
Pandas Core Syntax for Quant: Series, Indexing, and Financial Data
Pandas holds a central position in quantitative trading. Many data sources returning data via Python SDKs typically output pandas.DataFrame objects. Factor analysis libraries like Alphalens and performance evaluation tools like empyrical rely heavily on Pandas.
This is hardly surprising. Pandas’ creator, Wes McKinney, was originally a researcher at the asset management firm AQR Capital Management. While handling large-scale financial analysis tasks, he found that Python’s existing tools (such as NumPy) were inefficient for structured data analysis. Consequently, he began developing Pandas in 2008 and open-sourced it in 2009.
1.1. Basic Data Structures
The core data structures in Pandas are Series (similar to a one-dimensional array) and DataFrame (a rectangular data table).
1.2. Series
A Series consists of an array of data along with an associated set of data labels (i.e., an index). The simplest Series can be created from a single array. Series objects are presented interactively, with the index on the left and values on the right (typically, an index ranging from 0 to N-1 is automatically created, where N is the length of the data). Compared to NumPy arrays, you can select individual or grouped values from a Series using index labels. It can also be viewed as an ordered dictionary of fixed length; in scenarios where dictionaries are used, Series can serve as a substitute. For many applications, the most practical feature of Series is its ability to automatically align index labels during arithmetic operations.
from pandas import Series, DataFrame1.2.1. Creating from Arrays (Default Index)
obj = Series([1, 3, 5, 7])
obj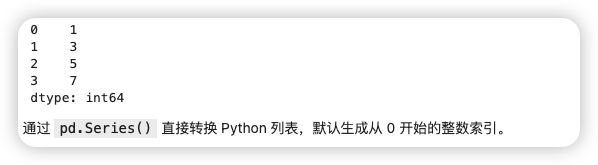
Converting a Python list directly via pd.Series() generates an integer index starting from 0 by default.
1.2.2. Creating from Dictionaries (Custom Index)
Dictionary keys automatically become the index, while values become the data:
obj = Series({"a": 4, "b": 3, "c": 2, "d": 1})
obj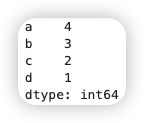
Conversely, a Series can be converted back to a dictionary using the to_dict method:
cprint("转换回字典:{}",obj.to_dict())1.2.3. Custom Indexing
Specify any immutable object as the index using the index parameter:
obj = Series([90, 85, 92], index=["数学", "英语", "物理"], dtype="float64")
obj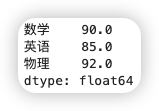
1.2.4. Creating Series with Timestamp Indices
Generate time-series data:
dates = pd.date_range("20230308", periods=4)
s = Series([100, 200, 300, 400], index=dates)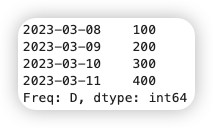
1.2.5. Querying Array Values and Index Objects
You can retrieve the underlying array values and index objects using the array and index attributes of a Series:
obj = Series([1, 3, 5, 7], index=["a","b","c","d"])
print("数组值:{}", obj.array)
print("索引对象:{}", obj.index)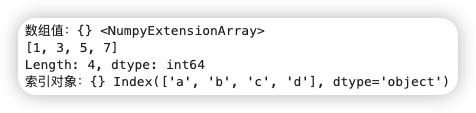
Unlike NumPy arrays, Series allows selection of individual or grouped values via index labels:
print(obj["a"])obj["d"] = 6
print(obj[["a","c","d"]])
print(obj[obj>5])
print(obj * 2)
print(np.exp(obj))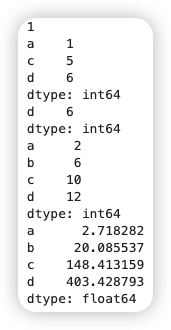
When constructing Series and Pandas objects, any arrays or other label sequences used are converted into index objects:
obj = Series(np.arange(3), index=["a","b","c"])
index = obj.index
print("index:",index)
print("index[1:]",index[1:])
# 注意Index对象是不可变的,因此用户不能对其修改
index[1]="d" # TypeErrorDue to the immutability of Index objects, they can be safely shared across multiple data structures:
labels = pd.Index(np.arange(3))
print(labels)
obj = Series([1.5,-2.5,0],index=labels)
print(obj)Below is a summary of common indexing methods and attributes:
| Method/Attribute | Description | Example |
|---|---|---|
append |
Concatenate additional index objects to create a new index. | new_index = index1.append(index2) |
diff |
Calculate the difference set of indices. | diff_index = index1.diff(index2) |
intersection |
Calculate the intersection of indices. | common_index = index1.intersection(index2) |
union |
Calculate the union of indices. | union_index = index1.union(index2) |
isin |
Return a boolean array indicating whether each value is contained in the passed set. | bool_array = index.isin(['a', 'b']) |
delete |
Delete elements at specified positions, returning a new index. | new_index = index.delete(0) |
drop |
Drop passed values, returning a new index. | new_index = index.drop('a') |
insert |
Insert elements at specified positions, returning a new index. | new_index = index.insert(1, 'new_value') |
is_monotonic |
Return True if the index is monotonically increasing or decreasing. |
is_monotonic = index.is_monotonic |
is_unique |
Return True if the index has no duplicate values. |
is_unique = index.is_unique |
| Method/Attribute | Description | Example |
|---|---|---|
unique |
Return an array of unique values in the index. | unique_values = index.unique() |
reindex |
Rearrange data according to a new index, filling missing values with NaN. |
new_series = series.reindex(new_index) |
reset_index |
Reset the index to default integer indexing, turning the original index into a column. | df_reset = df.reset_index() |
set_index |
Set a specific column as the index. | df.set_index('column_name', inplace=True) |
sort_values |
Sort the index values. | sorted_index = index.sort_values() |
to_series |
Convert the index to a Series. |
index_series = index.to_series() |
values |
Return the NumPy array of the index. | index_values = index.values |
name |
Get or set the name of the index. | index_name = index.name |
shape |
Return the shape (length) of the index. | index_shape = index.shape |
size |
Return the length of the index. | index_size = index.size |
The following code example, relevant to financial quantitative trading, demonstrates how to use Pandas to calculate stock moving averages (MA) and the Relative Strength Index (RSI):
import pandas as pd
import numpy as np
# 模拟股票价格数据
dates = pd.date_range("2025-01-01", periods=100)
prices = pd.Series(np.random.randint(100, 200, size=100), index=dates)
# 计算移动平均线 (MA)
ma_10 = prices.rolling(window=10).mean()
ma_20 = prices.rolling(window=20).mean()
# 计算相对强弱指数 (RSI)
delta = prices.diff()
gain = (delta.where(delta > 0, 0)).rolling(window=14).mean()
loss = (-delta.where(delta < 0, 0)).rolling(window=14).mean()
rs = gain / loss
rsi = 100 - (100 / (1 + rs))# 输出结果
result = pd.DataFrame({
"Price": prices,
"MA_10": ma_10,
"MA_20": ma_20,
"RSI": rsi
})
print(result.tail())