
Mining CSI Index Constituents for Quant Edge
On Monday, news that Warren Buffett significantly reduced his positions in the second quarter and held cash levels exceeding historical records dealt a heavy blow to global stock markets.
While marveling at Buffett’s wisdom, can we go a step further and learn something from the "Oracle of Omaha"?
In fact, Buffett has conveyed a considerable amount of investment experience and philosophy through his annual shareholder meetings.
Today, we start with one of Buffett’s famous wagers. This wager was made by Buffett at the 2006 shareholder meeting: a simple fund tracking the US stock market could defeat any confident hedge fund manager.
Buffett was right.
However, we are not discussing how to track indices today—that is what various index-enhancement strategies are already doing. Instead, we explore how to mine information from index constituents.
First, let’s look at index compilation data. We obtained the compilation catalogs for major Chinese indices, including SSE 50, CSI 300, CSI 500, and CSI 1000, from Wind (WanDe) over the years, and exported them into four Excel files, as shown below:
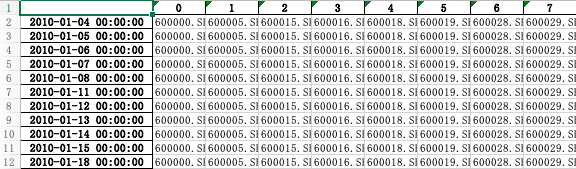
This displays the compilation data for the SSE 50. It is a dataset with over 3,000 rows and 50 columns. The index represents trading days, and the cell values are the codes of the constituent stocks for each trading day.
The other Excel files follow the same format, differing only in the number of columns.
First, we analyze changes in constituent stocks. The specific approach is to select an index, iterate through each row, and compare it with the previous row, recording differences for further analysis. This part of the code is straightforward, so we won’t demonstrate it here.
Then, we arrive at an important conclusion.
The STAR Market Is Rapidly Entering Broad-Based Indices
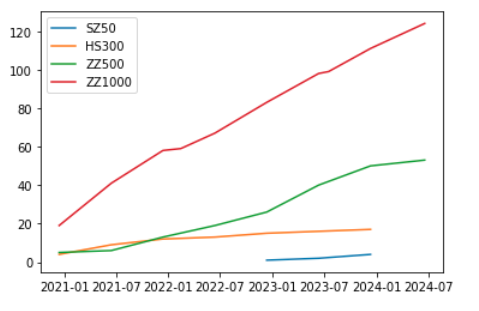
This chart shows the inclusion of STAR Market stocks in various broad-based indices.
We observe that the CSI 1000 began including STAR Market stocks in January 2021. By July this year, it had included 124 stocks, accounting for over 10%. Similarly, the CSI 500 started including them in January 2021 and has now included 53 stocks, also exceeding 10%.
The CSI 50 has a narrower scope and higher market-cap requirements, making inclusion more difficult. However, by early this year, it had included three companies.
Connecting this to China’s "Made in China 2025" plan and the development of "new quality productive forces," this conclusion is both surprising and expected.
The Strange Divergence
With this first discovery, we naturally become curious: how do STAR Market stocks perform after being included in an index?
Before answering this question, as part of our quantitative science popularization, we pose a question: How should we evaluate the performance of individual stocks after their inclusion in an index?
Generally, evaluation can be done by searching for index data or trading volume. However, these methods have flaws because they are unrelated to returns, making them less intuitive. Here, we propose two methods for discussion.
First, obtain the price changes of individual stocks one month before inclusion, one month after inclusion, and over 60 and 120 trading days after inclusion, and compare them with the market.
Second, rank the above indicators and observe changes in the rankings. Taking descending order of returns as an example, if the ranking drops (i.e., the numerical value decreases, indicating a higher rank), it means the stock’s performance after inclusion is better than the market.
question
Logically, evaluating the performance of stocks after index inclusion is a common practice and should facilitate academic research, implying there should be related papers. Unfortunately, as the author is not sufficiently erudite and has read too few papers, a simple search yielded no results. Comments and guidance are welcome.Let’s first look at December 14, 2020. We retrieve the market data for all stocks on that day, from one month before to 120 trading days after. We calculate the price change for the previous month (prev), one month after (20D), 60 trading days after (60D), and 120 trading days after (120D). We then sort these columns separately, denoting them as rank_prev, rank_20, rank_60, and rank_120.
The sorting method we use is pandas’ built-in function:
for col in ["prev", "20", "60", "120"]:
df[f"rank-{col}"] = df[col].rank(method='average', ascending=False)The method parameter ensures that if there are multiple identical values, pandas automatically selects a ranking.
This way, we obtain the previous month’s returns and future returns, along with their rankings, for all stocks on December 14. Next, we filter a sub-table containing only the STAR Market stocks that entered the CSI 1000 on that day, calculating the mean values for each metric.
In pandas, to select all rows from a DataFrame where a column’s value is in a specific set, we can use the following statement:
df[df['symbol'].str.contains('|'.join(includes))]Here, df is assumed to be the total table containing all individual stocks, and includes represents the STAR Market stocks added to the CSI 1000 on December 14.
The key point of this syntax is that if a pandas column is of string type, it has a str object. Through this object, we can call many string methods, including the contains method used here.
The contains method supports regular expression matching. Therefore, we use the join method to connect all elements in includes with vertical bars (|) to form a regular expression matching string, thereby selecting all newly added stocks in the CSI 1000.
tip
In regular expressions, the vertical bar `|` represents the logical "OR" operation. This means that if `A|B` appears in a regular expression, it will match either `A` or `B`.kcb_df = df[df['symbol'].str.contains('|'.join(includes))]
df = pd.concat((df.mean(), kcb_df.mean()), axis=1)
df.columns = ["all", "kcb"]
df.T[["prev", "20", "60", "120"]].T.plot.bar()
df.T[["rank-prev", "rank-20", "rank-60", "rank-120"]].T.plot.bar()
plt.title(date)
plt.show()Here, df is still the total table containing all individual stocks. The code uses transposition (T) multiple times, which is key to comparing the two series using pandas’ built-in functions and drawing bar charts.
Ultimately, we obtain the performance of the newly included STAR Market stocks in the CSI 1000 on December 14, 2020:
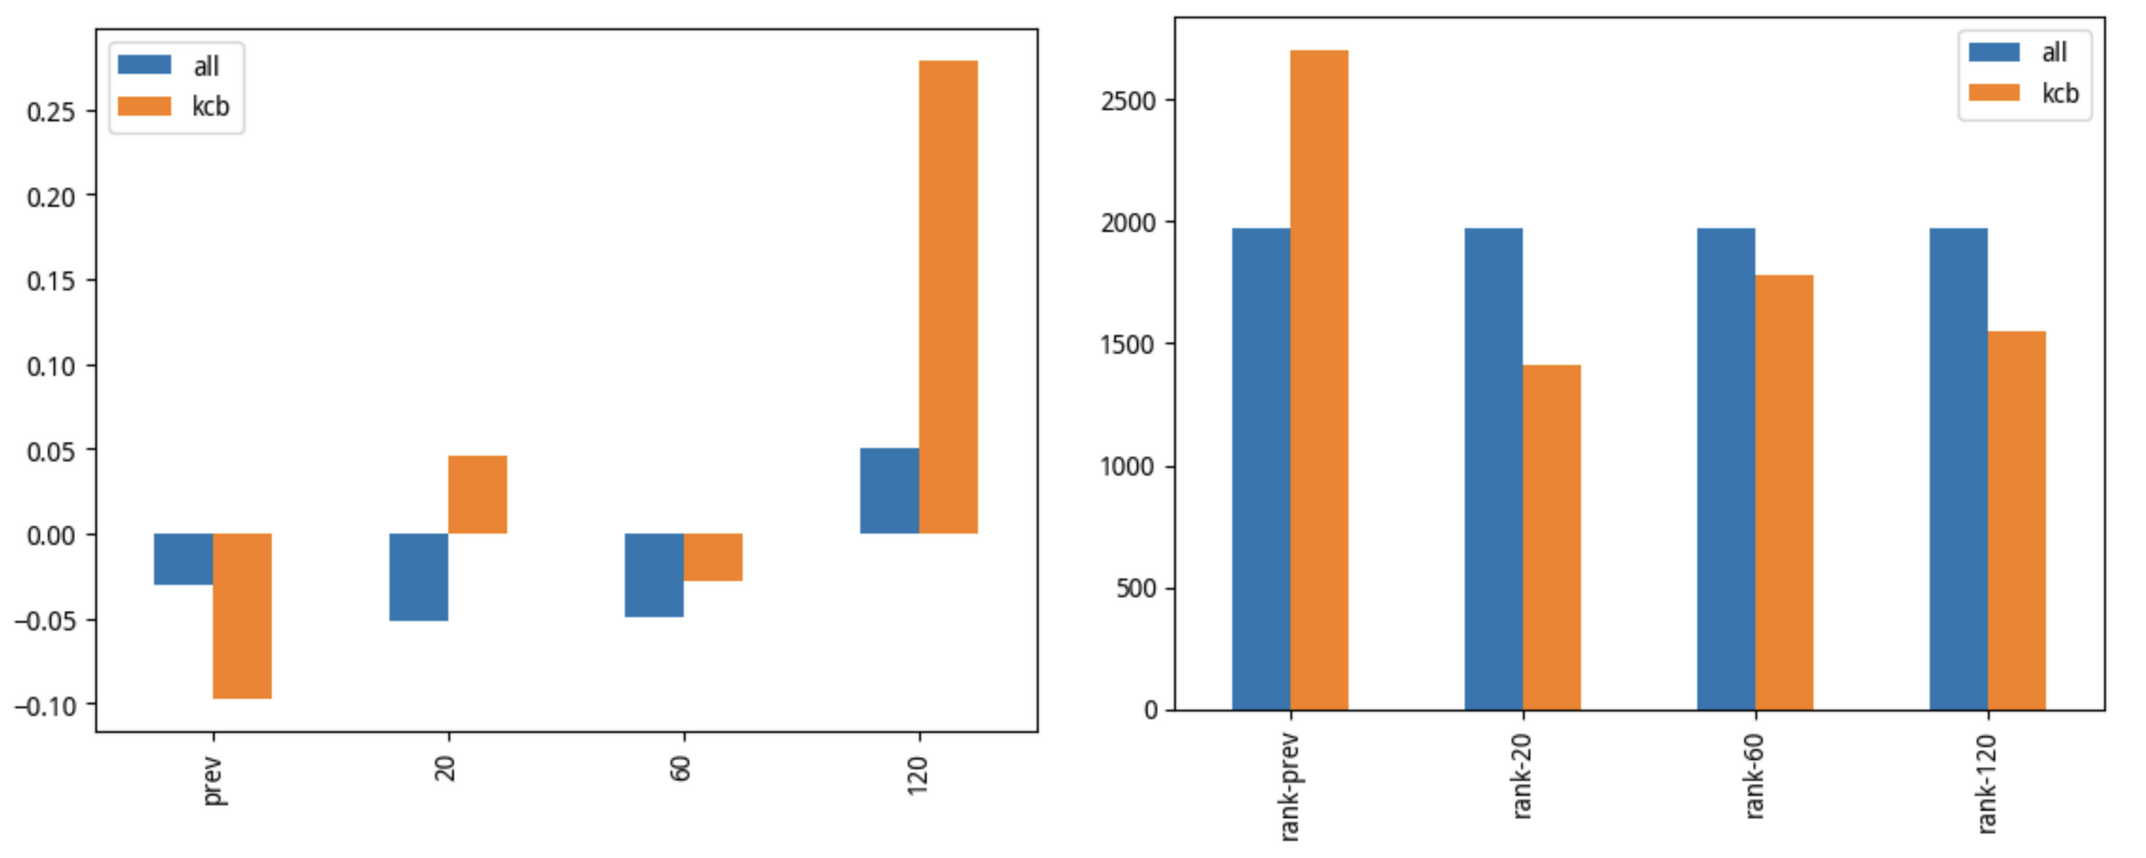
The left chart is the return comparison. From the left chart, we can see that before inclusion, these stocks’ declines were greater than the market’s; after inclusion, their performance was better than the market’s.
The right chart is the ranking comparison. From the right chart, we can see that after inclusion, the rankings of these stocks moved forward relative to the market, meaning their performance was better than the market’s.
However, do not be deceived by this conclusion. The following chart shows the performance of STAR Market stocks included in the CSI 1000 at the end of last year:
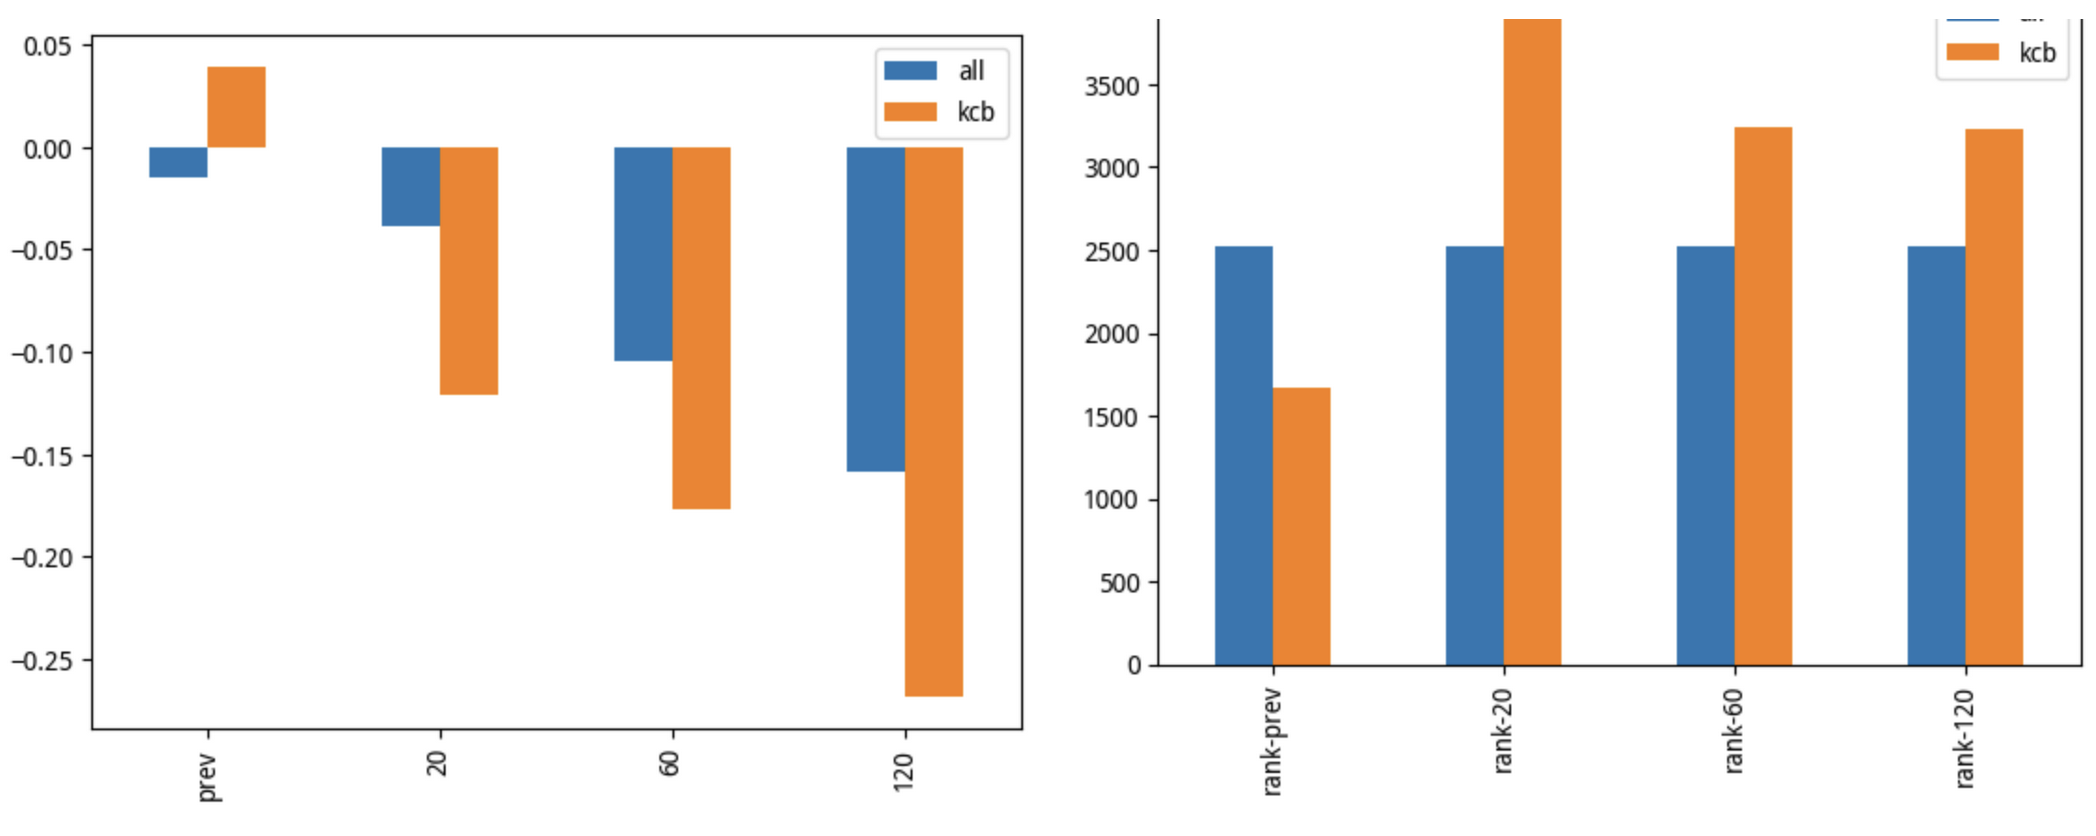
This is another classic example proving that correlation does not imply causation.
tip
With sufficient data, we can distinguish between correlation and causation. Unless, of course, this data is merely a projection of high-dimensional space onto a low-dimensional one. Lost information is lost forever.However, the primary classification of STAR Market stocks remains the STAR Market itself, so they are more influenced by the STAR Market’s overall trend.
Nevertheless, the STAR Market has been open for nearly five years, and it will celebrate its fifth anniversary in October this year. Undoubtedly, as broad-based indices accelerate the inclusion of STAR Market stocks, the securities market’s support for "new quality productive forces" is gradually being reflected. Therefore, regardless of the STAR Market’s past performance, research into it is now urgent.
Disclaimer: This article discovers a policy trend through data analysis. The conclusions may not be correct and do not constitute any investment advice.