
How to Detect Violent Washout Patterns Quantitatively
No shakeout, no rally. During the accumulation phase, the rising price action also attracts weak-handed followers, who become a drag on the coming main rally.
So before marking up the price, large players wash out these shaky low-cost holders. The process is often violent — like a wild horse trying to throw its rider.
A violent washout, in a sense, becomes one of the signals just before a fast rally.
In this article, we tackle a practical quant problem: how to detect washout patterns quickly?
Definition
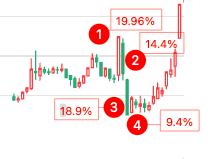
A violent washout is an empirical pattern observed in the market, so it has no strict definition. Conventionally, two big up days sandwiching one big down day is seen as a violent washout. In this article we define it as two up days sandwiching two down days, all with large moves. The method we introduce, however, works for other patterns as well with only minor parameter tweaks.
As shown on the left, before point 1 the stock went through a period of accumulation, and the resulting rally had already attracted some followers. At point 1, the main player drives a 20% limit-up move, trapping many momentum chasers at the top.
Starting on day 2, the shakeout begins, with drops of 14.4% and 18.9% over two consecutive days. Holders who bought at point 1 cannot stomach such huge losses and capitulate. The main player accumulates more shares at lower cost, leaving room for the later markup.
On day 4, a 9.4% rally marks the end of the washout.
The consolidation over the next few days mainly buys time for the next wave of followers to discover the name and gain the confidence to buy. A series of small bullish candles then builds an uptrend, culminating in another 20% limit-up — an 87% short-term gain measured from day 4.
Why do we use a 4-day, two-up-two-down pattern to define a washout?
Because a two-day washout works better in both time and price. From a behavioral perspective, many traders do not despair after losing money on the first day — a second down day is what finally breaks them and forces selling. Technically, two consecutive sharp drops also reset indicators more fully, freeing up more upside for the rally that follows.
We set a threshold for the move: if every bar in the window exceeds this threshold, we flag a washout. In our example, the threshold is 0.05, i.e., 5%.
Let's look at the implementation:
# 示例1
def feature_washout(bars, threshold=0.05):
"""返回在bars中最后一次洗盘结束的位置,-1表示最后一个bar,
0表示不存在洗盘模式
"""
close = bars["close"]
opn = bars["open"]
truerange = np.maximum(np.abs(close[1:] - close[:-1]),
np.abs(opn-close)[1:])
# 百分比化
tr = truerange / close[:-1]
sign = (opn < close)[1:] * 2 - 1
signed_tr = tr * signWe use the variable name truerange here because this snippet evolved from the technical indicator TR.
This code converts price changes into a pattern expressed with 1, -1 and 0, so we can search for patterns later.
If the daily change exceeds 5%, or the body range exceeds 5%, we mark it as 1 or -1, otherwise 0. The sign is determined by whether it is a bearish or bullish candle: -1 for bearish, 1 for bullish.
This simple line identifies bullish vs. bearish candles:
(opn < close) * 2 -1It produces an array of 1s and -1s. Whether the close is up or down, we always treat a bearish candle as part of the washout. So even a high-open bearish candle that still closes higher is treated as washout action.
Below is an example of a high-open bearish-candle washout:
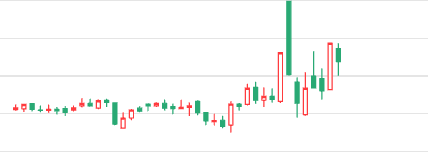
When checking whether each bar's change or body range exceeds the threshold, we use a simple trick: np.maximimum to take the element-wise maximum across multiple arrays via element-wise comparison. That is, given arrays $A$ and $B$, $np.maximum(A, B)$ returns an array whose elements are the larger of the corresponding elements in $A$ and $B$.
In other words, if the result is $C$, then $C_0$ is the larger of $A_0$ and $B_0$, $C_1$ is the larger of $A_1$ and $B_1$, and so on.
Besides the $np.maximimum$ ufunc, $np.max$ can also do the job, except that we first need to stack arrays $A$ and $B$ into a matrix:
# 示例2
A = np.arange(4)
B = np.arange(3, 7)
C = np.arange(8, 4, -1)
Z = np.vstack((A,B,C))
# 通过np.max求每列最大值
r1 = np.max(Z, axis=0)
# 通过np.maximum求最大值
r2 = np.maximum.reduce([A, B, C])
# 比较两种方法的结果是否相同
np.array_equal(r1, r2)To be more illustrative, we demonstrate the element-wise maximum across three arrays here. The answer is to use the reduce method. If you only compare two arrays, np.maximum alone is enough.
After processing with Example 1, we might get an array like this:
[ ... 0.04 -0.02 -0.06 0.04 -0.04 -0.
Clearly, we should binarize it into a pattern like [big up, big down, big down, big up] (i.e., [1, -1, -1, 1]):
# 示例3
encoded = np.select([signed_tr > threshold,
signed_tr < -threshold],
[1, -1], 0)
for i in range(len(encoded) - 3, 0, -1):
if np.array_equal([-1, -1, 1], encoded[i:i+3]):
return i - len(encoded) + 2
return 0We complete the binarization with the select method. Then a reverse loop with array_equal completes the pattern matching.
In backtesting, we may need to extract all washout patterns from a long price history at once to test their performance. The code above can be further optimized with numpy.lib.stride_tricks.sliding_window_view:
def feature_washout(bars):
...
washouts = []
for i, patten in enumerate(sliding_window_view(encoded, window_shape = 4)):
if np.array_equal(patten, [1, -1, -1, 1]):
washouts.append(i)
return washoutsBy binarizing returns, we can conveniently match patterns later with array_equal. We do this because qualitative analysis is basically enough here: as long as the move exceeds 5%, whether it fell 5.1% or 7.2%, we treat it as a washout.
But if you still think quantitative magnitude matters, you can also match patterns by calculating Pearson correlation.
What values should the template pattern use, though? If you are interested, leave a comment to get our recommended parameters.