
How Decimalization Changed Spreads and Strategy
My note Left-Digit Effect, Round Numbers, and Light Refraction cited a paper by USC's Lawrence Harris on clustering in transaction prices. Such clustering matters for pinpointing resistance levels and refining execution algorithms.
But in 2001, U.S. equities switched from fractional to decimal pricing. That change invalidated much of his conclusion.
This highlights a must-watch issue in quant: is the data you analyze continuous and consistent? Were there any regime shifts or changes in collection along the way? If so, can you still treat data from before and after the break as a single sample?
This post uses that episode to review the U.S. shift from fractions to decimals, as a reminder to scrutinize data sources in quant research. As WorldQuant's Finding Alpha argues, the most important part of finding alpha may simply be understanding the data you have. Flaws in the data itself are the most common yet hardest-to-detect source of bias.
Historically, U.S. stocks used a minimum increment (minimum spread, also called tick size) of 1/16 of a dollar. This convention was sometimes called fractions. Starting in April 2001, ticks moved to decimals, with a minimum increment of $0.01. From 2005, Rule 612 allowed stocks priced under $1 to be quoted in increments of $0.0001.
According to Harris et al. in Stock Price Clustering and Discreteness, under fractional ticks prices clustered heavily on whole dollars — wholes were more common than halves (i.e., 8/16), and halves more common than quarters. For example, on December 31, 1987, in the CRSP (Center for Research in Security Prices, a University of Chicago affiliate — a key U.S. equity database with a 55-year history) daily stock file, 2,431 out of 2,510 closing prices were divisible by 1/8, with 17.3% on whole dollars and 12.8% on half-dollars. This phenomenon is critical for optimizing order placement. It also significantly boosted market-maker profits compared with decimals.
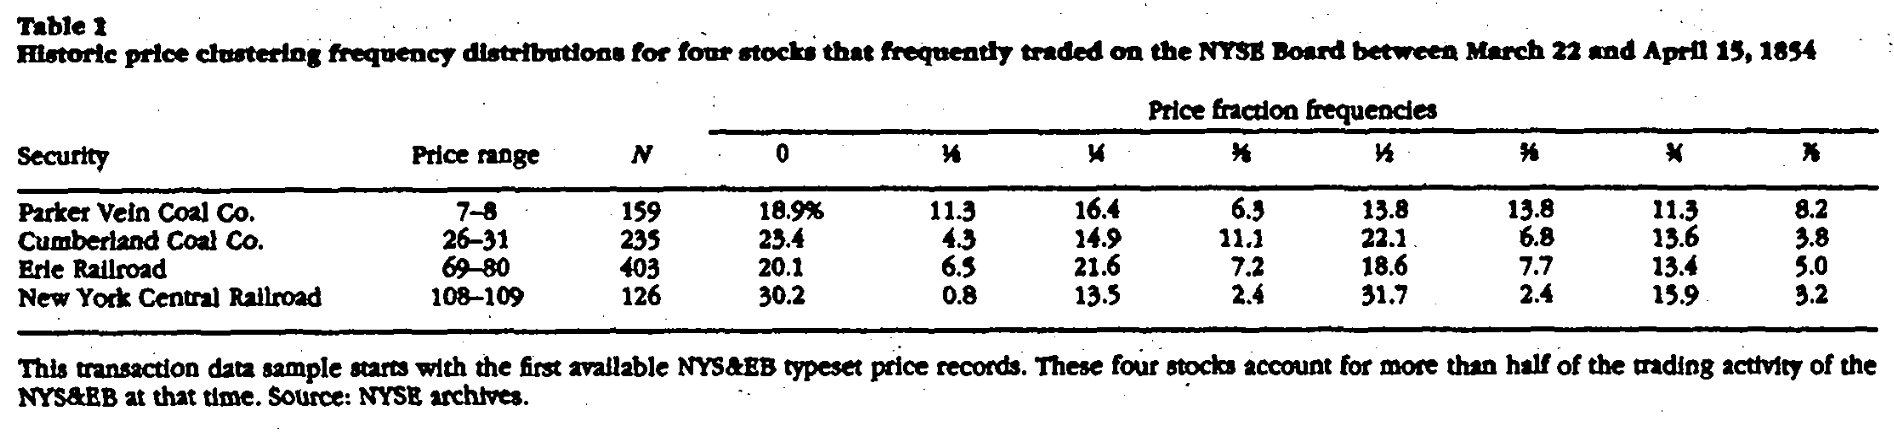
When the minimum tick switched to decimals — a minimum unit of $0.01 — several things happened: first, the value of time priority in matching declined. With a tiny tick, a trader could improve the price slightly to jump ahead and get filled. Before, with a large tick, improving the price gave up too much profit, so traders preferred to hold price and queue longer. Decimalization therefore modestly increased volume, because fills became easier.
Harris's paper contained other important findings. Clearly, with the rule change, those conclusions — especially about price distributions — no longer held. Trading algorithms built on those observations (especially execution algorithms and market-making strategies) had to be revised.
Moreover, under fractions, round-number resistance and support were stronger (although a dollar was split into 16 ticks, traders tended to use only a handful — 0, 1, 4, 8 and the like — so orders piled up on those ticks, making resistance and support stronger). After decimalization, take a $2 stock as an example: $2.0, $2.1, $2.2 all the way to $2.9 are all memorable, easy-to-trade round levels, so clustering weakened somewhat.
In addition, impatient traders would bid $2.11 to buy or offer $2.09 to sell, dispersing prices further. Round-number support and resistance under decimals were therefore lighter than under fractions. If your strategy (factor) depends on round numbers, your data should not span the April 2001 break.
During decimalization, He Yan (Singapore Management University) and co-authors studied the differences. Their paper, “Price Rounding and Bid-Ask Spreads Before and After the Decimalization”, published in the International Review of Economics & Finance, concluded that after decimalization prices tended to cluster on 100, 50, 25, 10 and 5 cents, and market-maker profits declined.
But both papers are quite academic and do not spell out what this price clustering means for trading:
- Price clustering creates high-volume zones that act as resistance and support. The shift from fractions to decimals created new clustering points — in other words, resistance and support drifted. Related factor strategies needed to be revised.
- Execution algorithms need to be optimized for this phenomenon
- The shift from fractions to decimals could invalidate existing market-making strategies.
In addition, in China A-shares we find that for prices below 10 yuan, clustering may occur at every 0.1 yuan rather than 0.05, while indexes may cluster around 100 points. If you want to explore these patterns yourself, He Yan et al.'s methodology is worth borrowing.
In China A-shares, there are similar breaks. Around 2005, A-shares went through the split-share reform and entered the full-circulation era. For the same company, tradable shares changed dramatically before versus after the reform, and per-share fundamentals inevitably shifted as well.
You can think of this as a fundamental fault line. So if you are doing fundamental analysis, you should first check whether spanning 2005 affects your data.
Some data vendors only provide data starting in 2005. Whether or not that was the reason, it makes sense.