
Alphalens Factor Analysis: Low-Turnover Factor Example (1)
Factor analysis is one of the core skills in quant research. Once you find effective factors through factor analysis and remove redundant ones by correlation, you can combine them with machine learning, linear regression, and other methods to build a trading strategy.
In this note we show how to run single-factor analysis with Alphalens. Our test case is a low-turnover factor.
There is an old market saying: record volume marks the top; extremely low volume marks the bottom. The logic is that when volume explodes to a record high, the game of musical chairs runs out of new buyers and the rally is hard to sustain, so prices will likely fall. When volume shrinks to rock bottom, trading is extremely quiet and trapped holders refuse to cut losses. With selling pressure gone, a rebound becomes likely.
There are two ways to measure the size of volume.
One is along the time-series dimension, where we use the minimum or maximum volume over the past n days. The larger the n, the more information it contains. The other is ranking across the cross-section, in which case volume must first be aligned. The way to align it is to convert volume into turnover rate.
Turnover Rate
Turnover rate is the frequency at which a security changes hands over a given period, and it is one of the indicators of trading activity. It is calculated as $$换手率 = \frac{成交额}{流通股数}$$In this note we still use the free AKShare feed. However, since access to QMT quant data is now very easy to obtain — getting QMT access is essentially getting this data for free — later notes will mainly use QMT, and only fall back to AKShare for instruments QMT does not yet cover.
Our low-turnover factor will be built on CSI 300 constituents. The full workflow is:
💡 1. Get the CSI 300 constituent codes
💡 2. Get price and turnover-rate data for those constituents over a period
💡 3. Build the factor and forward-returns data required by Alphalens
💡 4. Run factor testing and analysis
Alphalens can produce a large number of reports (one example below), so step 4 will be covered in detail over several notes.
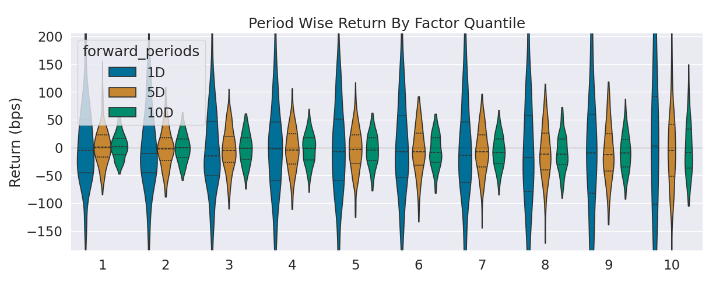
A complete factor analysis workflow covers raw data acquisition, factor generation, data (and factor) preprocessing, and factor testing.
Preprocessing includes counting missing values, neutralization, outlier clipping, standardization, and similar steps; factor testing includes IC analysis, layered backtests, and other methods.
Factor generation involves the core algorithm and has to be done by the researcher. In this example no extra construction is needed — we simply use turnover rate directly.
Fetching Data
We fetch the CSI 300 constituents with the following code:
import akshare as ak
df = ak.index_stock_cons_csindex(symbol="000300")
secs = df["成分券代码"]
secsWe use the index_stock_cons_csindex API to get index constituents, where 000300 is the code for the CSI 300.
You will see output like 000001, 000002, and so on. AKShare security codes often come without an exchange suffix.
warning
This already introduces an error. Data returned by index_stock_cons_csindex reflects the latest constituents. But the constituent list is updated continuously. If we had fetched the CSI 300 list in January 2023, the result would likely differ from what we get today.Since exchanges tend to add stocks making new highs to an index and remove laggards, failing to use PIT data means we have actually overstated this factor's return.
bars = ak.stock_zh_a_hist("000001", adjust="hfq", start_date="20150104")
bars.tail()
The return has many columns; we only care about date, close, and turnover rate. This API has an adjust parameter for the adjustment method. In this example qfq and hfq make no difference, but unadjusted data must not be used.
Once you are familiar with the basic AKShare APIs, we can formally fetch the data and convert it into the format Alphalens expects:
from typing import List
def prepare_data(secs: List[str], start: str, end: str):
factors = []
prices = []
for sec in secs:
bars = ak.stock_zh_a_hist(sec, adjust="qfq", start_date=start, end_date=end)
bars["asset"] = [sec] * len(bars)
prices.append(bars[["日期", "asset", "收盘"]])
factors.append(bars[["日期", "asset", "换手率"]])
# 处理因子表
factor = pd.concat(factors)
factor.rename(columns = {"换手率":"factor", "日期":"date"}, inplace=True)
factor["date"] = pd.to_datetime(factor["date"], utc=True)
factor.set_index(["date", "asset"], inplace=True)The factor dataframe required by Alphalens for analysis looks like this:
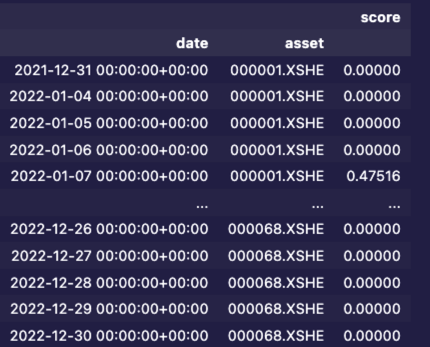
The key point is that it must be a DataFrame with a dual index of date + asset. The dataframe should have only one column. The column name is not mandated, but a name like factor is recommended because it is easier to understand (bad example here!).
stock_zh_a_hist can only return market data for one stock at a time. We first add an asset column (set to the stock code), then simply concatenate the turnover-rate data of each stock into one large dataframe, rename columns, and set a MultiIndex.
Note that Alphalens requires timezone-aware datetimes — time zones must be set, and the timestamps in the two tables must be consistent.
The date field returned by AKShare is a string, so we need one conversion. Turnover rate and close data already come as float64.
def prepare_data(secs: List[str], start: str, end: str):
...
# 接上一段代码, 处理 PRICES 表格
prices = pd.concat(prices).pivot(index="日期", columns="asset", values="收盘")
# 价格表 INDEX 类型转换: STR -> DATE
prices.index = pd.to_datetime(prices.index, utc=True)
# 价格表 INDEX 名字必须转换为'DATE'
prices.rename_axis('date', inplace=True)
return factor, pricesThe prices table must be converted into the following format:
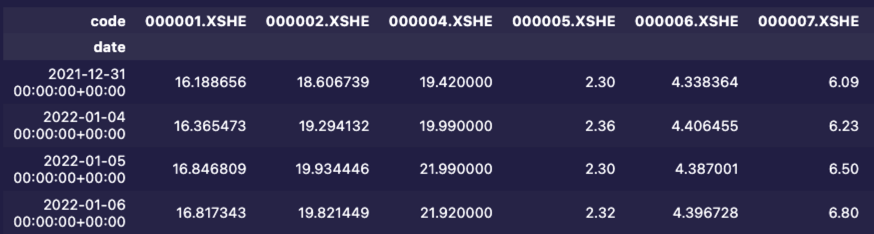
The point of the format is a dataframe indexed by date with each asset code as a column, where each cell holds the closing price of that asset on that day.
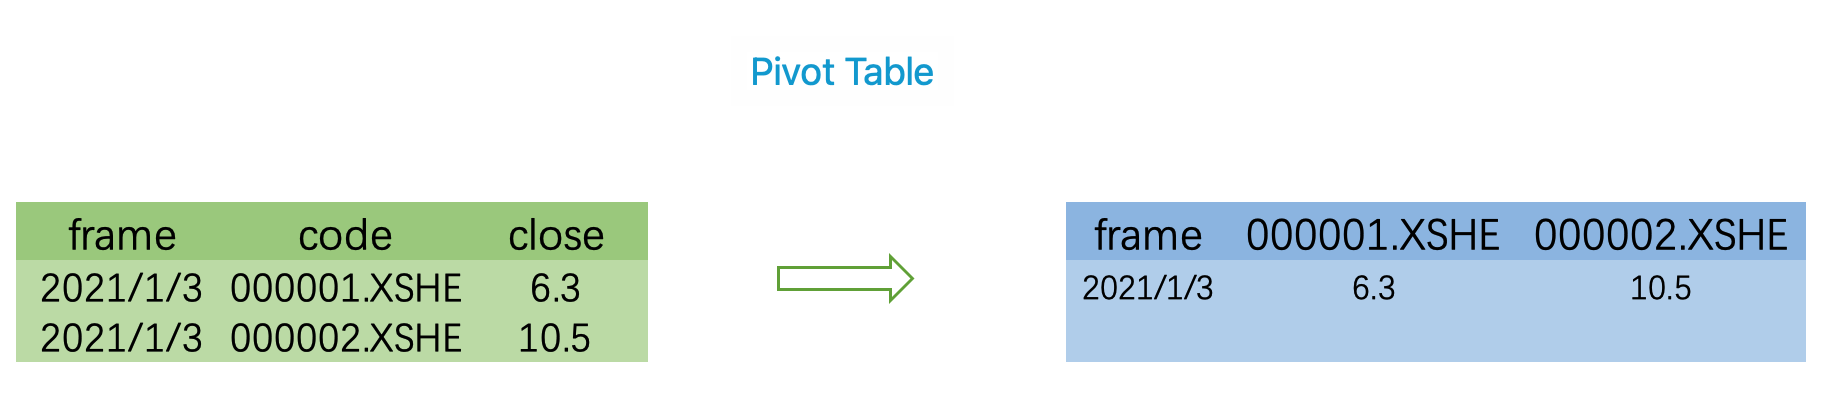
We first concatenate the per-stock price frames, then reshape with the pivot function to get the format above. This transformation is illustrated below:
We now have data that meets Alphalens requirements. Data preparation is done.
Data Preprocessing
Alphalens will handle missing values, neutralization, standardization, and other steps for us if needed. Alphalens provides the get_clean_factor_and_forward_returns API:
from alphalens.utils import get_clean_factor_and_forward_returns
factor_data = get_clean_factor_and_forward_returns(
factor,
prices,
bins=None,
quantiles=10
)
factor_data.tail()The cleaned result looks like this:
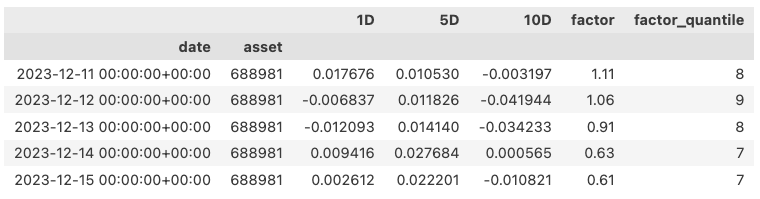
Factor analysis covers the absolute-return method, IC analysis, and stratification, all handled together in Alphalens — you can choose to look at only one result, but at the preprocessing stage the corresponding parameters must be passed in. The bins/quantiles parameters here are used for layering.
bins/quantiles work much like the same-named parameters in dataframe cut or hist(). Here is a brief introduction.
In the example above we set quantiles=10, which sorts each day's factor data from smallest to largest and then splits it by len(df)/10, so each slice contains roughly the same number of factor records (not exactly equal due to handling of missing values and similar effects).
We can group the result to check:
factor_data.groupby("factor_quantile").count()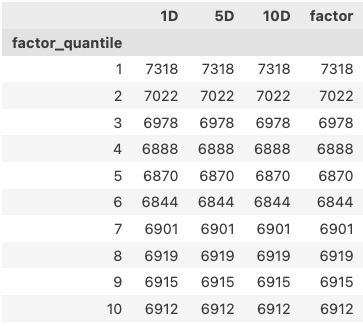
If instead of the quantiles parameter we set bins to 10, it evenly divides the interval [min(factor), max(factor)], so each bin has the same width but contains a different number of observations. The grouped result looks like this:
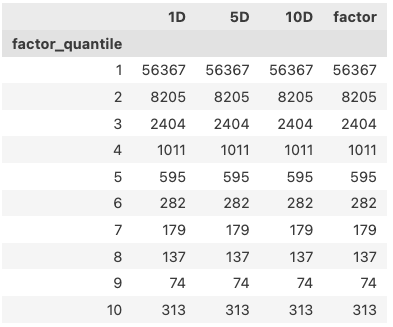
Placed side by side, the similarities and differences between the two parameters are self-evident.
Why use quantiles in this example?
We want to test the saying that extremely low volume marks the bottom. So we should buy the stocks with the lowest turnover rates. To balance risk, we might buy 30 names, or about 10% of the universe. Splitting by quantiles is therefore the right choice.Alphalens is reloaded
Despite its large user base, Alphalens is no longer maintained. But the Python libraries it depends on keep moving forward. If you use Alphalens now, you will run into this error: ```text AttributeError: 'Index' object has no attribute 'get_values' ``` This error is caused by pandas updates.Fortunately, ml4trading has taken over maintenance via alphalens-reloaded. If you plan to use this library, please also give the project a star on Github.