
Moonshot: A Minimalist Python Framework for Quant Backtesting
For fundamental strategy backtesting, you might find frameworks like backtrader too heavy, while Alphalens isn’t suitable for daily data. Additionally, as a beginner, you may want to implement a strategy backtest from scratch to understand the underlying mechanics. This is a valid approach, but the key question is: how do you implement it?
This series uses a 2023 research report from China International Capital Corporation (CICC) as a case study to demonstrate how to build a complex strategy backtest. We will cover key techniques such as data acquisition, preprocessing, and framework design.
 Figure 1: CICC Research Report
This strategy approaches stock selection from three dimensions: dividend yield, capital gains, and risk aversion. It combines event-driven stock selection with factor investing. The final backtest results show an annualized return of 29% over the past five years.
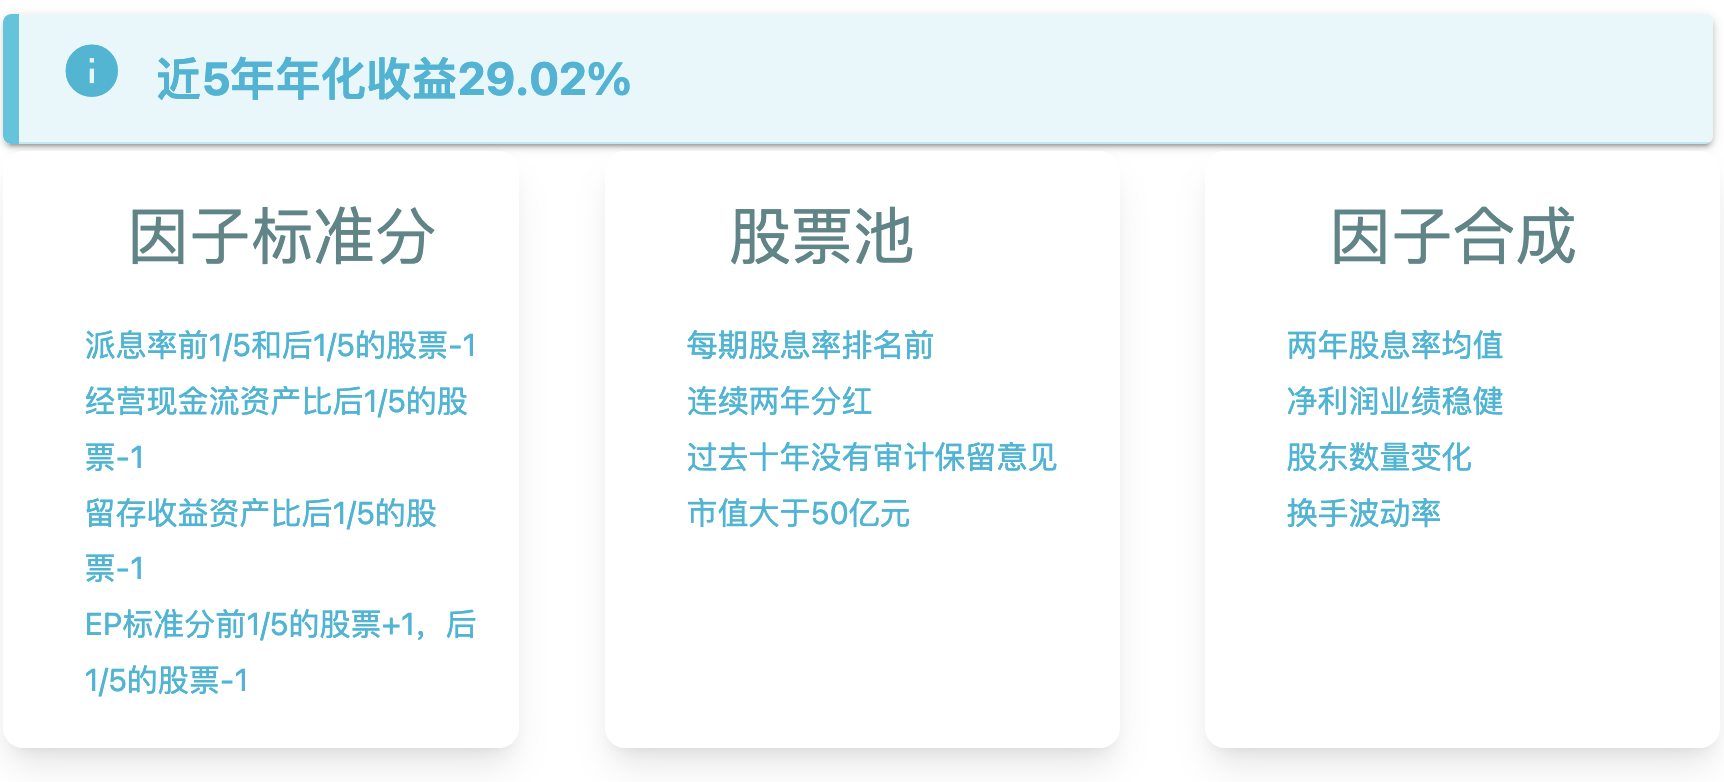 Figure 2: Fundamental Strategy Construction Logic
We will implement a universal framework suitable for monthly rebalancing strategies, featuring:
- Monthly rebalancing, ideal for fundamental strategies
- Clear separation of module responsibilities, making it easy to stack and combine
- Simplicity and ease of use
Core Driving Framework
In simple terms, backtesting involves the following steps within a specified historical period:
- Generate trading signals based on data available at that time.
- Execute rebalancing based on trading signals.
- Calculate returns for each trading period of the strategy.
- Evaluate the strategy and visualize results.
Generally, step 1 is the core of the strategy. Different strategies use different data, construct different factors, and employ different decision logic. However, the other parts can be reused. Specifically, for step 4 (strategy evaluation and visualization), we will use Quantstats.
tip
Using a well-known third-party framework for strategy evaluation is not just about saving time; it is crucial for comparing strategies. Although algorithms are public, different strategy evaluation frameworks may differ in how they handle missing values or default parameter choices.Assume we have already acquired daily stock price data. Since our strategy involves monthly rebalancing, we resample the price data to a monthly frequency.
The data now looks like this:
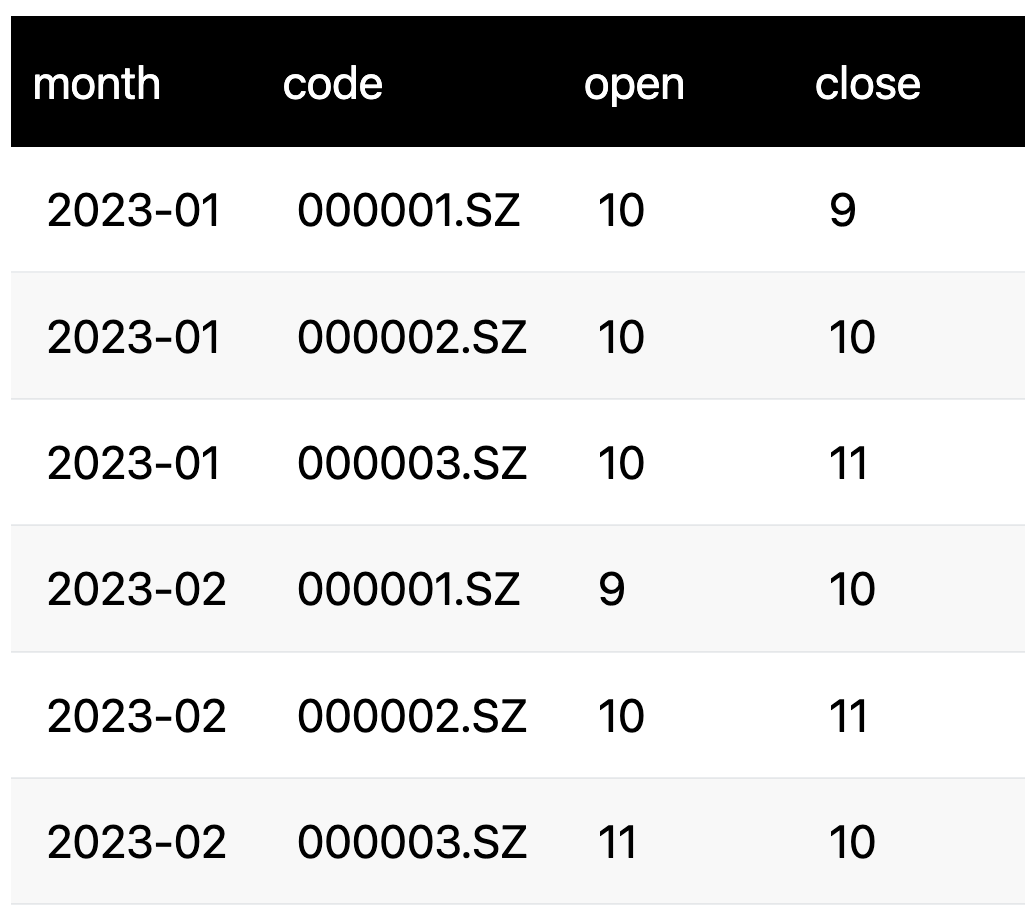 Figure 3: Monthly Price Data
Resampling data to a monthly frequency is a critical technique for monthly rebalancing strategies. If you don’t do this, you must first determine the rebalancing day for each month (which varies), and then look up the factor data and closing price for individual stocks on that specific day. If a stock is suspended on the rebalancing day, you will encounter missing data.
Another benefit is that we can now buy at the opening price of the next month after generating a rebalancing signal in the previous month, and sell at the closing price of the next month. This strictly avoids look-ahead bias. Some strategies calculate returns using only closing prices, which inevitably either introduces look-ahead bias or results in delayed signal response.
Now, calculating returns becomes straightforward. For example, calculating benchmark returns is:
df.groupby("month").apply(lambda x: (x.close / x.open - 1).mean()) Figure 4: Benchmark Return Calculation
How do we calculate portfolio returns? We need to add a column to mark which stocks are in the stock pool for that month:
 Figure 5: Portfolio Return Calculation
In Figure 5, we added three columns. filter_1 is used to screen basic data; for example, if the research report requires selecting the top 500 stocks by dividend yield each month, this column would contain the dividend yield data.
The flag column is a marker indicating whether an individual stock is in the stock pool, generated based on the filter_1 column. In the figure, we assume the rule is that if filter_1 is greater than zero, the stock is included in the stock pool for the following month. This gives us the stock pool for February 2023.
Now, when calculating strategy returns, we only need to execute the following monthly:
$$ \frac{\sum(returns \times flag)}{\sum flag} $$
This yields the monthly strategy returns. This step corresponds to the following code:
df.groupby("month").apply(lambda group: group[group["flag"] == 1]["returns"].mean())Up to this point, we have clarified the tasks required to implement a minimalist monthly backtesting framework:
- Acquire price data and resample it to a monthly frequency.
- Acquire relevant data based on strategy requirements and construct factors.
- Resample the factors constructed in step 2 to a monthly frequency and append them to the DataFrame generated in step 1.
- Convert the
factorcolumn into aflagcolumn based on strategy logic. - Calculate benchmark and strategy returns on a monthly basis.
- Call
quantstatsto generate the backtest report.
Implementation of Moonshot
We named this minimalist framework Moonshot because it is better suited for strategies with fixed monthly rebalancing. Its core is a class named Moonshot:
class Moonshot:
def __init__(self, daily_bars: pd.DataFrame):
self.data: pd.DataFrame = resample_to_month(
daily_bars, open="first", close="last"
)
self.data["flag"] = 1
self.strategy_returns: pd.Series | None = None
self.benchmark_returns: pd.Series | None = None
self.analyzer: StrategyAnalyzer | None = None
def append_factor(
self, data: pd.DataFrame, factor_col: str, resample_method: str | None = None
) -> None:
"""Add factor data to the backtest data (i.e., self.data).
If the resample_method parameter is not None, the data needs to be
resampled to a monthly frequency using the method specified by
resample_method. Otherwise, it is assumed that the factor is already
at a monthly frequency and will be added directly to the backtest data.
This method can only add one factor at a time.
Args:
data: Factor data, must contain 'date' and 'asset' columns.
factor_col: Name of the factor column.
resample_method: If the factor needs resampling, this specifies the method.
"""
if resample_method is not None:
factor_data = resample_to_month(data, **{factor_col: resample_method})
else:
data_copy = data.copy()
# Ensure the date column is of datetime type
if not pd.api.types.is_datetime64_any_dtype(data_copy["date"]):
data_copy["date"] = pd.to_datetime(data_copy["date"])
data_copy["month"] = data_copy["date"].dt.to_period("M")
# Check for duplicate (month, asset) combinations
duplicates = data_copy.duplicated(subset=["month", "asset"])
if duplicates.any():
duplicate_count = duplicates.sum()
raise ValueError(
f"Found {duplicate_count} duplicate (month, asset) combinations."
"When resample_method=None, the input data must be non-duplicate monthly data."
"If your data is daily frequency or has duplicate records, please specify the resample_method parameter,"
"such as: resample_method='last', 'mean', 'first', etc."
)
factor_data = data_copy.set_index(["month", "asset"])[[factor_col]]
self.data = self.data.join(factor_data, how="left")
def screen(self, screen_method, **kwargs) -> "Moonshot":
"""Apply stock screener.
Args:
screen_method: Screener method (callable object).
**kwargs: Screener parameters.
Returns:
Moonshot: Returns itself to support chain calls.
"""
if callable(screen_method):
flags = screen_method(**kwargs)
# Select stocks in the current month, open positions in the next month
flags = flags.groupby(level="asset").shift(1).fillna(0).astype(int)
# Logical AND with existing flag
self.data["flag"] = self.data["flag"] & flags
return self
def calculate_returns(self) -> "Moonshot":
"""Calculate strategy and benchmark returns (vectorized implementation).
Uses vectorized operations to calculate:
1. Strategy returns: Equal-weighted average return of stocks with flag=1 each month.
2. Benchmark returns: Equal-weighted average return of all stocks each month.
"""
# Calculate monthly returns for all stocks (close - open) / open
self.data["monthly_return"] = (self.data["close"] - self.data["open"]) / self.data[
"open"
]
# Calculate strategy returns grouped by month (equal-weighted average of stocks with flag=1)
def calculate_strategy_return(group):
selected = group[group.get("flag", 0) == 1]
if len(selected) > 0:
return selected["monthly_return"].mean()
else:
return 0.0
strategy_returns = self.data.groupby("month").apply(calculate_strategy_return)
strategy_returns.name = "strategy_returns"
# Vectorized calculation of benchmark returns (equal-weighted average of all stocks)
benchmark_returns = self.data.groupby("month")["monthly_return"].mean()
benchmark_returns.name = "benchmark_returns"
# Store results
self.strategy_returns = strategy_returns
self.benchmark_returns = benchmark_returns
self.analyzer = StrategyAnalyzer(
strategy_returns=self.strategy_returns, benchmark_returns=self.benchmark_returns
)
return selfThe usage of Moonshot is as follows:
daily_bars = ...
ms = Moonshot(daily_bars)
# Construct factors and add them to the model
ms.append_factor(...)
# Backtest
ms.screen(screen_func, **kwargs).calculate_returns().report()Upon initialization, Moonshot requires us to pass in daily price data so it can build the most basic data structure (Figure 3). Then, we can add factors to the model via append_factor.
Next, we need to define the transformation function screen_func to implement monthly stock screening based on factors, i.e., the transformation shown in Figure 5.
We define the screen method to support chain calls. This way, if a strategy has multiple screening conditions, the user only needs to define various screening conditions (screen_func) and call the screen method in sequence.
Finally, the screen method returns a Moonshot instance, on which we can call methods to calculate returns and output reports.
In Moonshot, we also call a method named resample_to_month, which resamples time series data to a monthly level.
Pandas already provides a resample method:
df.groupby("asset").resample("ME").agg({"open": "first", "close": "last"})However, when the data volume is large (e.g., around 500,000 records), this method is relatively slow. In one run, I waited about 10 seconds. This is because pandas' aggregation operations have always been a performance bottleneck, which is where polars or duckdb have their advantages.
Here, we provide a polars implementation:
def resample_to_month(data: pd.DataFrame, **kwargs) -> pd.DataFrame:
"""Resample to monthly frequency, supporting simultaneous resampling of multiple columns.
Example:
>>> resample_to_month(data, close='last', high='max', low='min', open='first', volume='sum')
Parameters:
data: DataFrame, must contain 'date' and 'asset' columns. Data does not need to be sorted.
**kwargs: Keyword arguments, in the format "column_name=aggregation_method".
Supported aggregation methods: 'first' (first value), 'last' (last value),
'mean' (average), 'max' (maximum), 'min' (minimum).
Returns:
Resampled DataFrame.
"""
df = pl.from_pandas(data)
df = df.with_columns(pl.col("date").cast(pl.Datetime))
df = df.with_columns(
pl.concat_str(
[
pl.col("date").dt.year().cast(pl.Utf8),
pl.lit("-"),
pl.col("date").dt.month().cast(pl.Utf8).str.pad_start(2, fill_char="0"),
]
).alias("month")
)
# Define mapping of supported aggregation methods (column name -> aggregation expression)
agg_methods = {
"first": lambda col: col.sort_by(pl.col("date")).first(),
"last": lambda col: col.sort_by(pl.col("date")).last(),
"mean": lambda col: col.mean(),
"max": lambda col: col.max(),
"min": lambda col: col.min(),
"sum": lambda col: col.sum(),
}
# Build list of aggregation expressions
agg_exprs = []
for col_name, method in kwargs.items():
if col_name not in df.columns:
raise ValueError(f"Column does not exist in data: {col_name}")
# Check if aggregation method is supported
if method not in agg_methods:
raise ValueError(
f"Unsupported aggregation method: {method}, supported methods are: {list(agg_methods.keys())}"
)
# Add aggregation expression
agg_exprs.append(agg_methods[method](pl.col(col_name)).alias(col_name))
if not agg_exprs:
raise ValueError("At least one column's aggregation method must be specified (e.g., open='first')")
result = (
df.group_by(pl.col("asset"), pl.col("month"))
.agg(agg_exprs)
.sort(pl.col("month"), pl.col("asset"))
)
result = result.to_pandas()
result["month"] = pd.PeriodIndex(result["month"], freq="M")
return result.set_index(["month", "asset"])This function accepts a DataFrame as input and returns a DataFrame, using polars only in the intermediate process. The additional data format conversion incurs negligible performance loss. However, insisting on using DataFrames as the data transfer format between modules and methods significantly reduces coding complexity.
Now, let's use real data to construct a Moonshot object and see the results of the resample_to_month() function.
start = datetime.date(2018, 1, 1)
end = datetime.date(2023, 12, 31)
barss = load_bars(start, end, 100)
ms = Moonshot(barss.reset_index())
ms.dataWe can now see that the data has indeed been resampled to a monthly frequency, and the index has been set to monthly timestamps.
That’s it for this issue. In the next episode, we will implement the first screener from the research report: dividend yield. We will fully implement data acquisition, define the screener method, and conduct a complete backtest.