Larry Williams’ Ultimate Oscillator: A 10x Quant Strategy
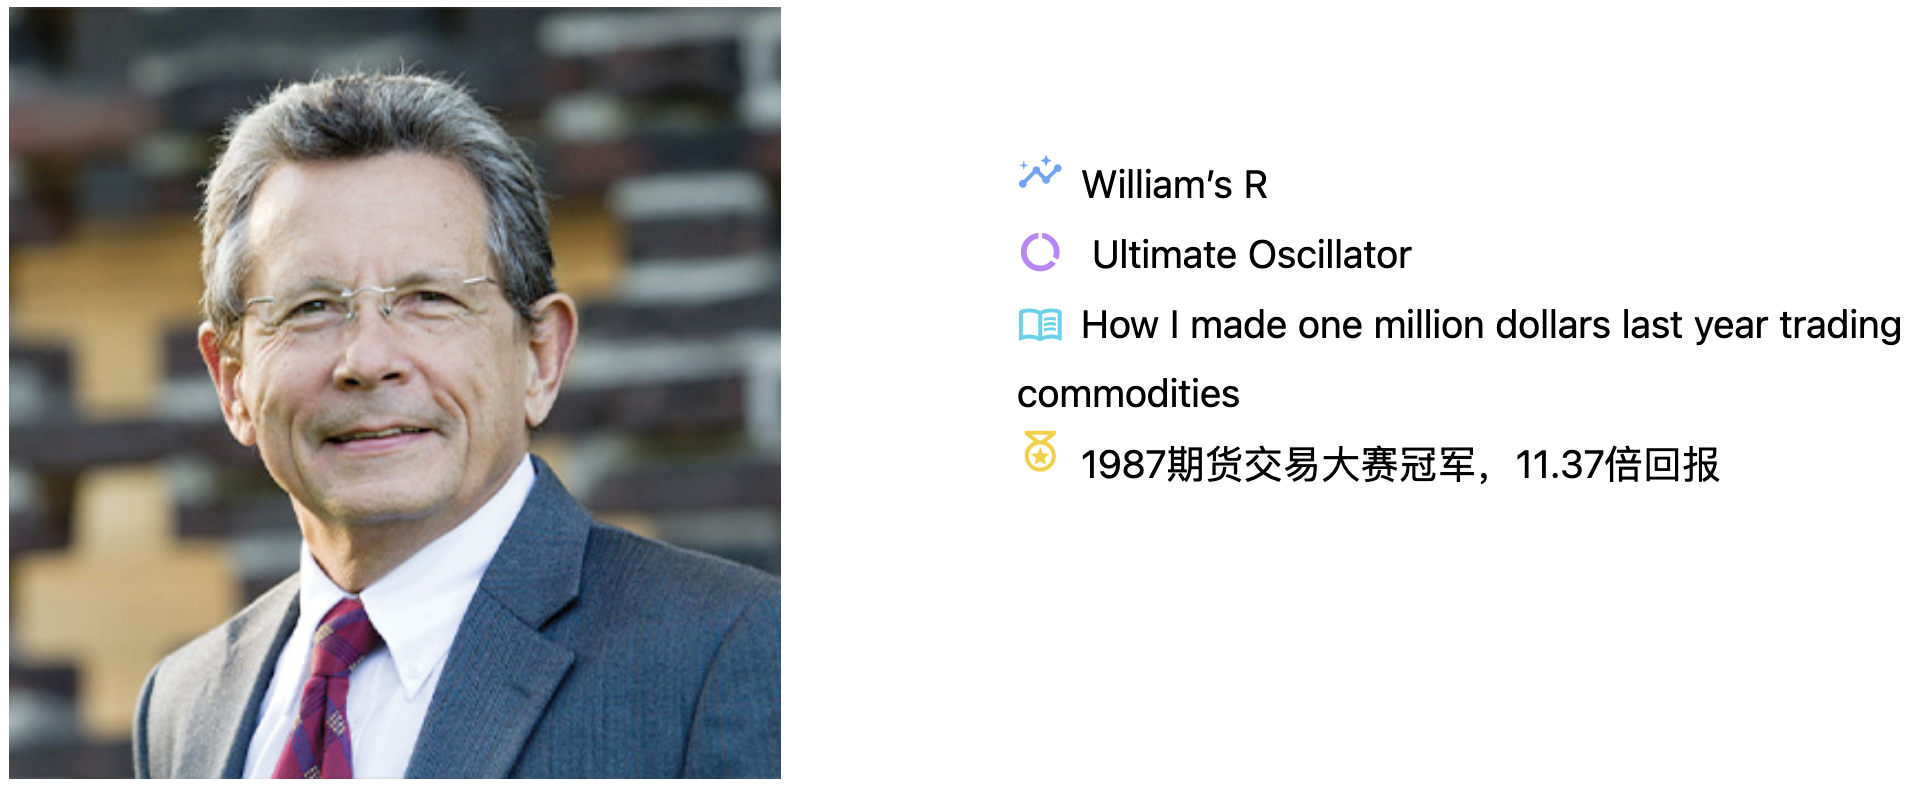
The Ultimate Oscillator (UO) is a technical analysis factor published by Larry Williams in 1976.
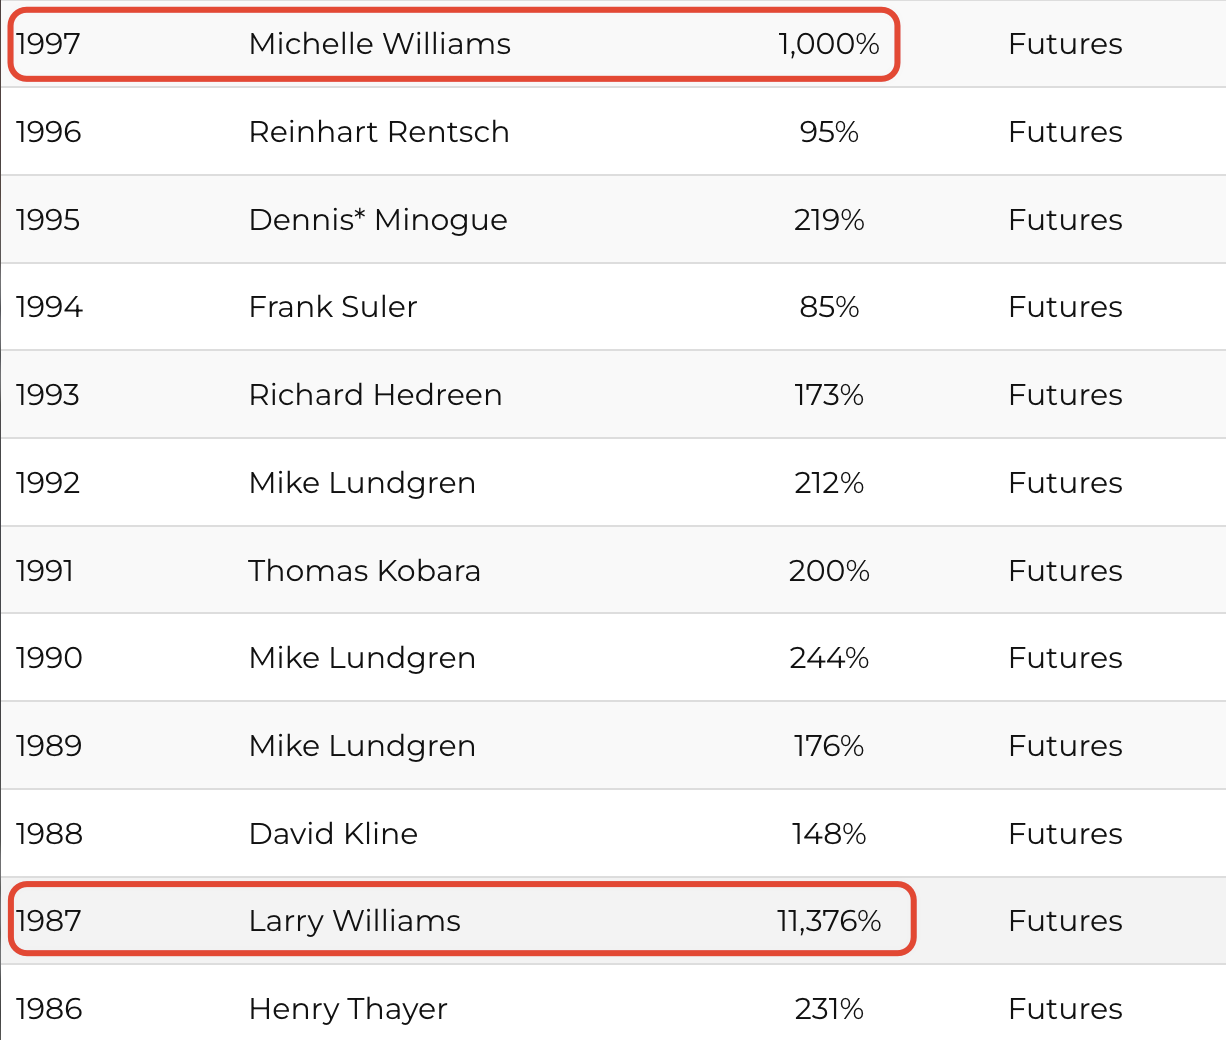
Larry Williams is a formidable figure who backs up his claims with results. He invented two key indicators: William’s %R (WR) and the Ultimate Oscillator. He is also the author of How I Made $1,000,000 Last Year Trading Futures. Notably, he won the 1987 World Futures Trading Championship, securing a first-place return of 11.37x.
Even more impressive is the Williams family’s dominance in trading—a true "three-generation dynasty."

This is his daughter, Michelle Williams. She is a renowned actress, known for roles in films like Brokeback Mountain, and has received four Academy Award nominations for Best Supporting Actress. More remarkably, she also won the World Futures Trading Championship in 1997, achieving a 10x return. In the history of this championship, only three traders have achieved such returns; the Williams family accounts for two of them.
This fact demonstrates that Larry Williams’ trading techniques remain highly effective over a decade later.
Larry Williams’ son is a psychiatrist and the author of The Psychological Edge in Trading. Given his proximity to two world champions, he certainly has ample material for his writing.
Below is the calculation formula for the indicator.
$$ \text{True Low} = \min(\text{Low}, \text{Previous Close}) \ \text{True High} = \max(\text{High}, \text{Previous Close}) \ \text{BP} = \text{Close} - \text{True Low} \ \text{True Range} = \text{True High} - \text{True Low} \ \text{Average BP}n = \frac{\sum{i=1}^{n} BP_i}{\sum_{i=1}^nTR_i} \ ULTOSC_t=\frac{4Avg_t(7) + 2Avg_t(14) + Avg_t(28)}{4+2+1} \times 100 $$
The indicator aims to reduce false signals by combining buying pressure across different time horizons, thereby providing more reliable overbought and oversold signals. The Ultimate Oscillator considers three distinct time periods, typically 7, 14, and 28 days, to capture short-, medium-, and long-term market momentum.
The calculation steps are somewhat complex, involving concepts such as True Low, True High, True Range, and Bull Power.
The following diagram clarifies the logic.
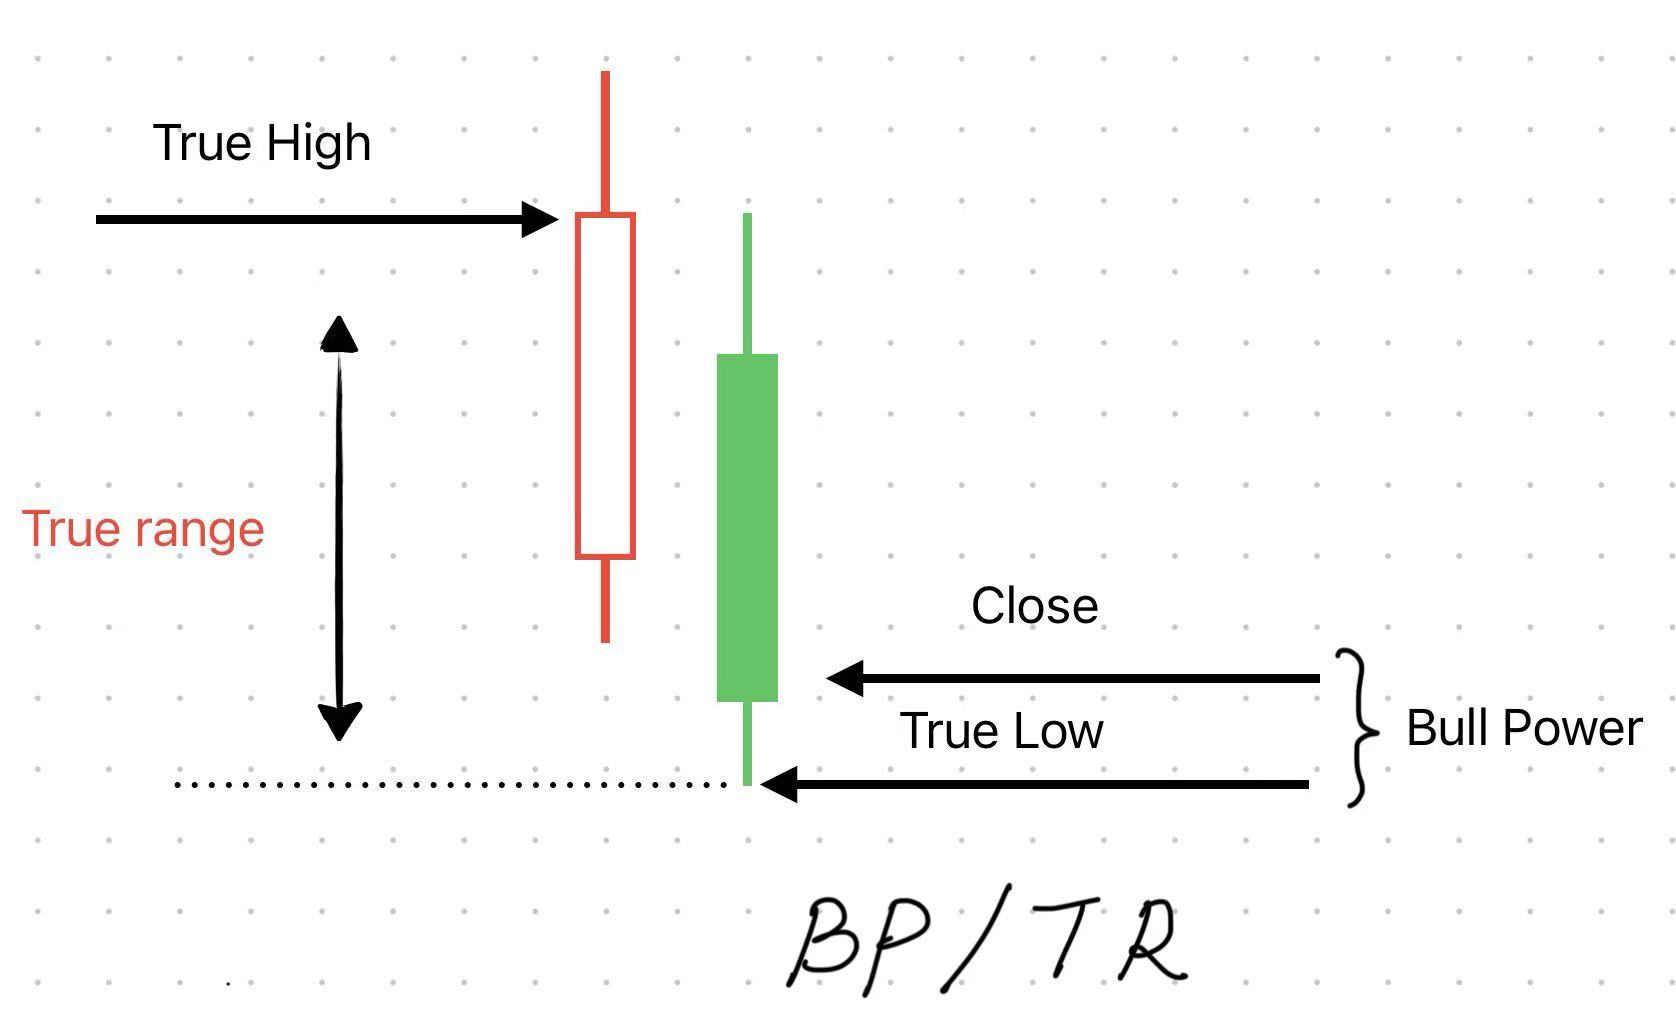
The so-called True Range incorporates the previous close alongside the day’s high and low to calculate the maximum amplitude. It then computes the price increase from the True Low to the current close, representing bullish strength (Bull Power).
Finally, by dividing Bull Power by the True Range and averaging over a specific window, we obtain the normalized mean of bullish strength.
The indicator combines these averages across long, medium, and short periods to generate the final metric.
Structurally, the key difference between UO and the RSI is the inclusion of both high and low price series.
Traders know that the day’s high and low prices are determined by the博弈 (game/struggle) between bulls and bears, embedding critical information. Those who monitor the order book in real-time feel this even more acutely.
For instance, the highest price is reached only after the main force consumes enough chips to push it up. If the chips above cannot be consumed, the high price is set at that level. The unconsumed chips represent the cost basis or other psychological price levels of larger capital, which become future resistance levels.
Therefore, compared to the RSI, the Ultimate Oscillator contains more information. It is hoped that this interpretation will inspire your future factor exploration.
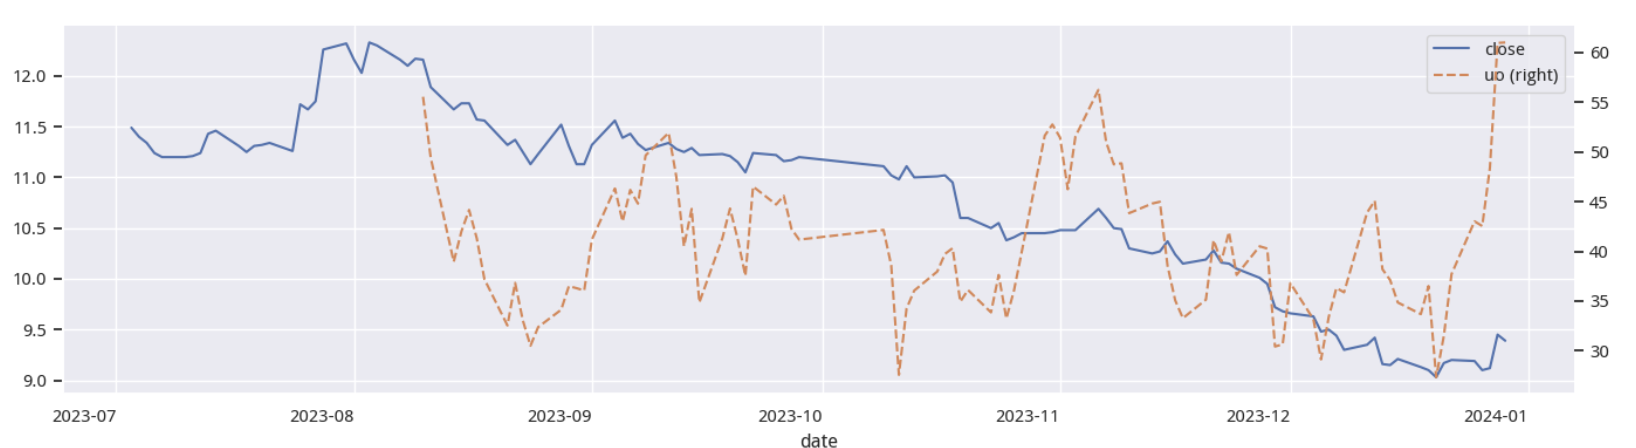
The following chart demonstrates what the UO indicator looks like in practice. Visually, it resembles the RSI, oscillating within a certain range.
How does this factor perform in backtesting? Over a six-year period from 2018 to 2023, its annualized alpha reached 13.7%, showing excellent performance.
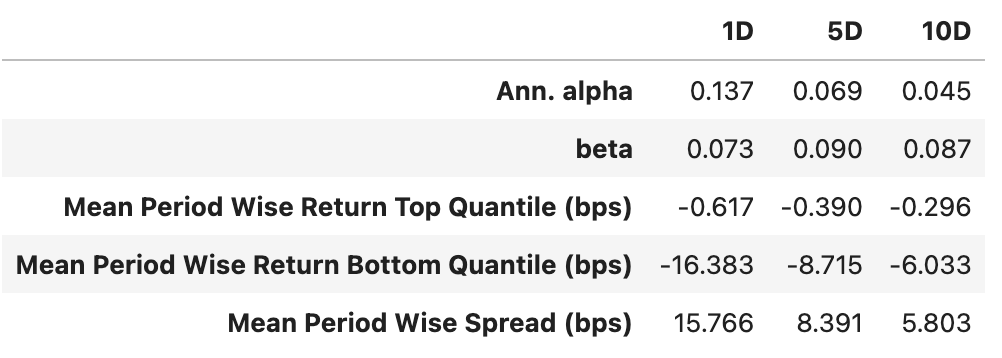
However, the factor’s returns are primarily driven by short positions. As seen in the layer-by-layer return chart, returns are mainly contributed by shorting in Layer 1. In a pure long-only strategy, alpha is modest at only 1.6%, with returns largely driven by beta, resulting in higher portfolio volatility.
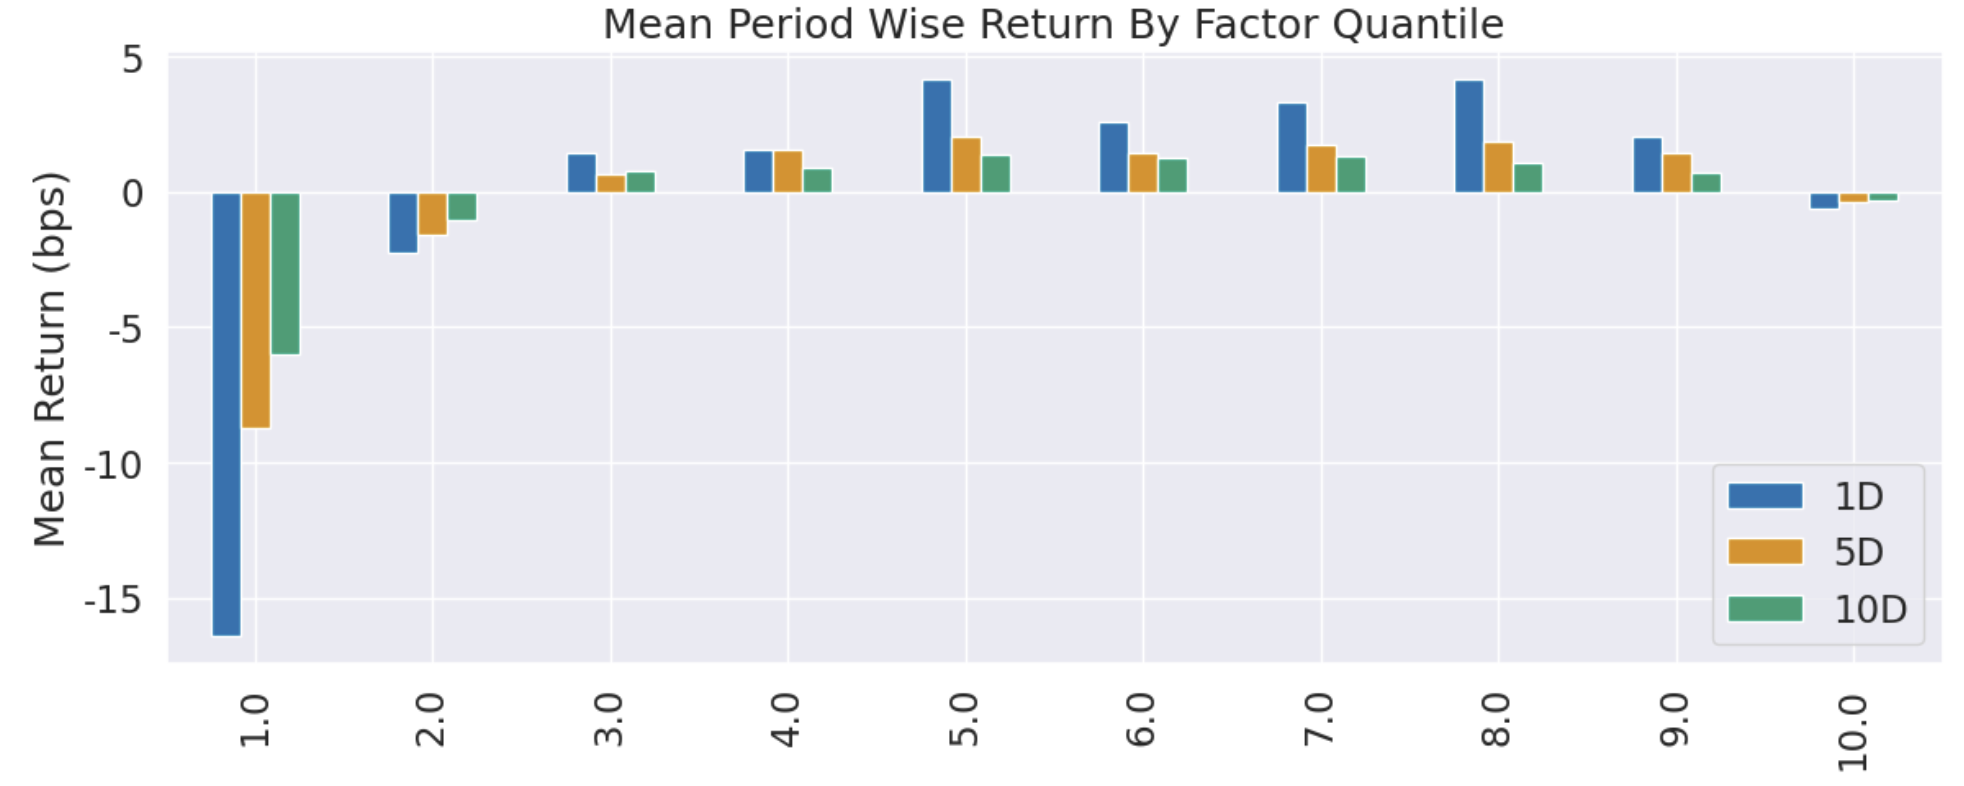
Thus, this indicator performs better in futures markets.
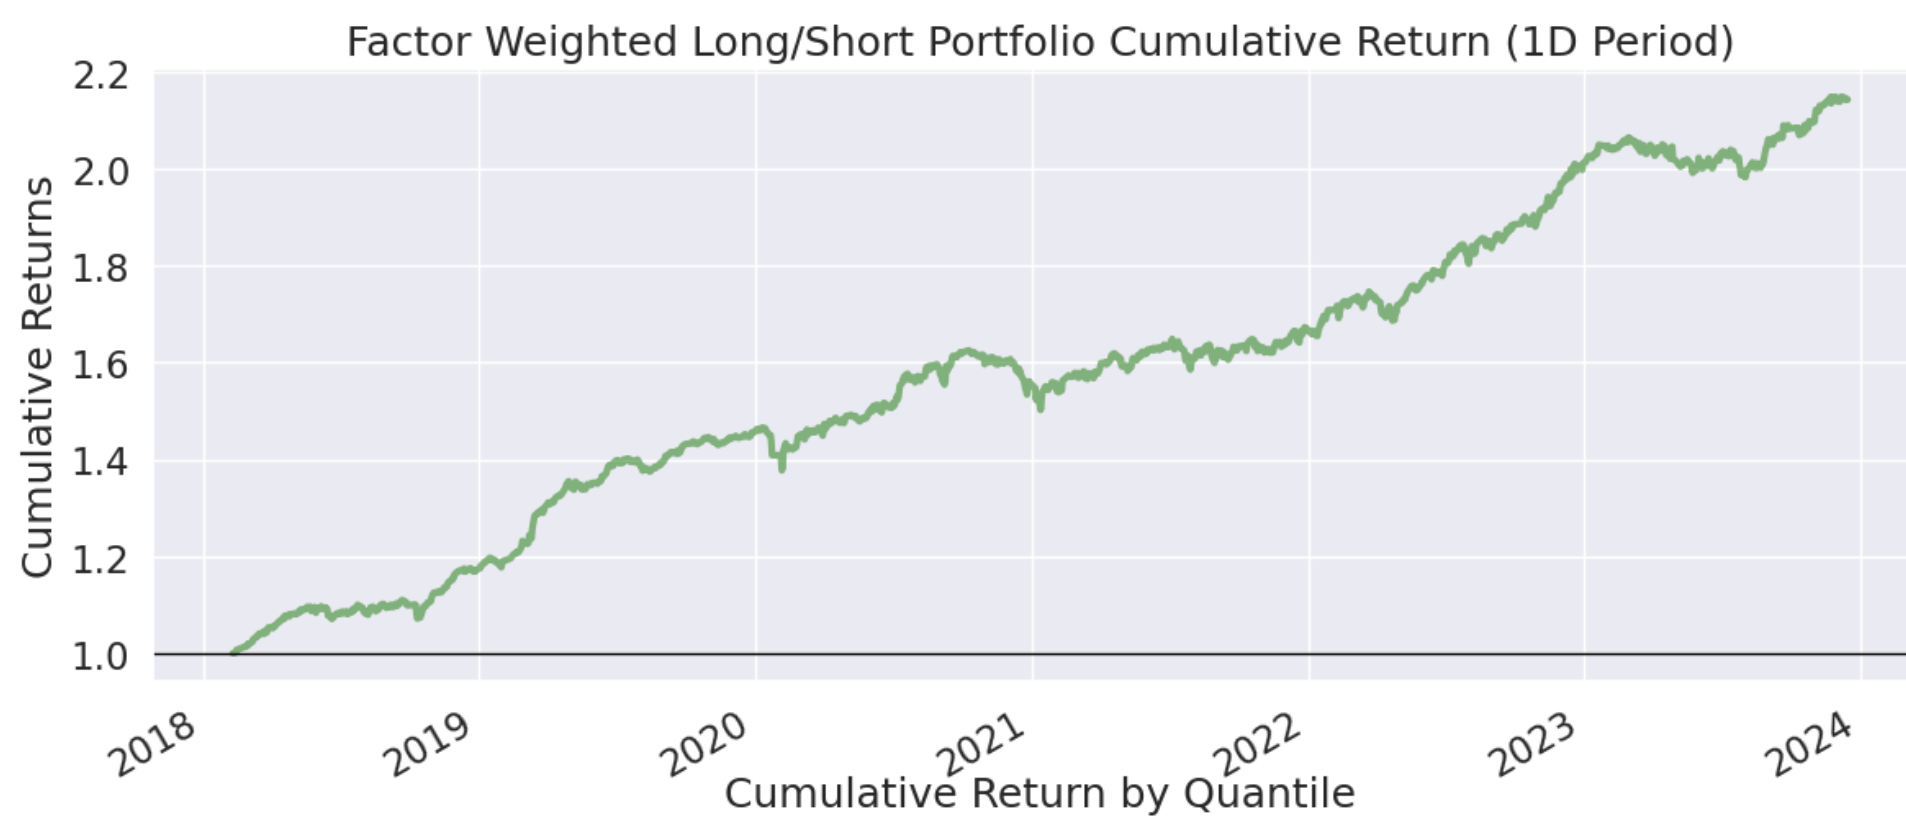
Under a long-short portfolio, the six-year return reached 2.2x.
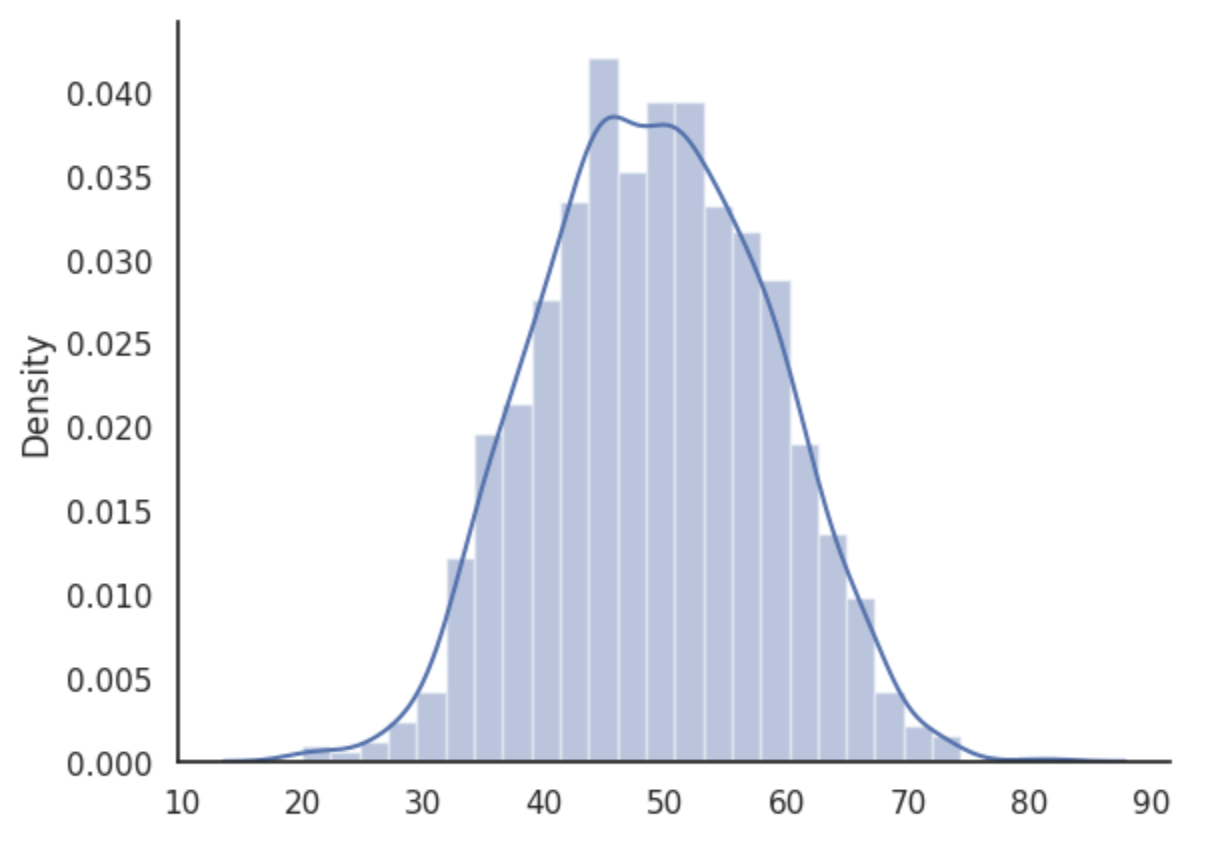
Finally, let’s examine the factor density distribution. It appears to follow a normal distribution, showcasing symmetric beauty.
From the layer-by-layer mean return chart, we can make a minor optimization in trading: eliminating factors in Layer 8 and above. After this adjustment, the annualized alpha reached 24% between 2018 and 2022, with a cumulative five-year return of 2.75x.
We retained 2023 data as out-of-sample data for testing. In the 2023 backtest, the annualized alpha reached 13%, indicating no overfitting. The cumulative return curve for 2023 is as follows:
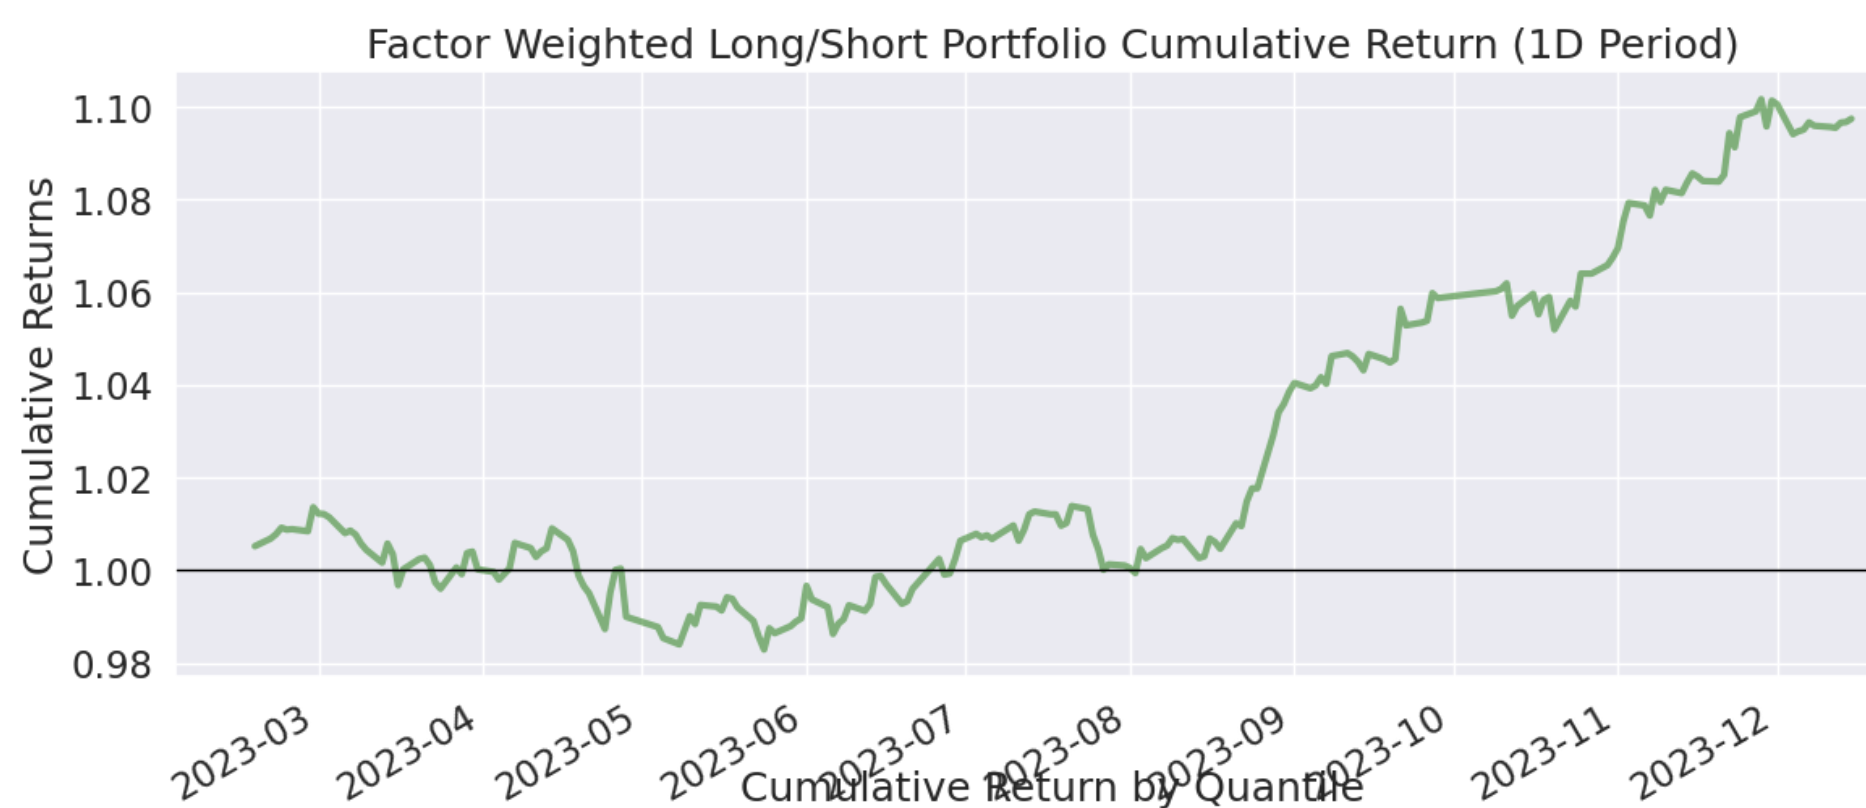
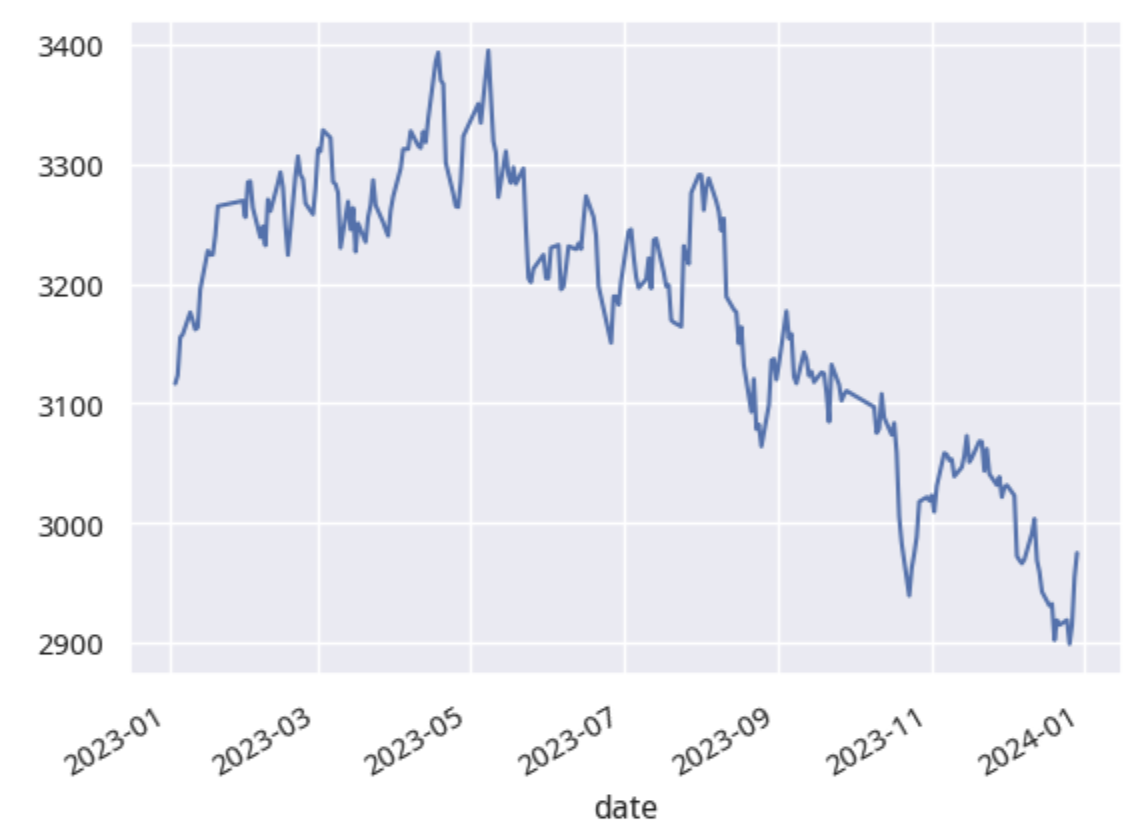
During the same period, the Shanghai Composite Index was predominantly declining. The rally starting in late August coincided in timing with the rise of DMA strategies.
The complete test code is available upon joining the community.