
Validating HDBSCAN for Stock Selection via Cointegration
The previous article introduced using the HDBSCAN algorithm to cluster assets. After clustering, we perform cointegration tests on the results. By calculating hedge ratios, we can construct stationary sequences. We know that a stationary time series has constant mean and variance with autocorrelation properties. Consequently, once it deviates from the mean, it will eventually revert to it. We can leverage this characteristic to generate trading signals.
But how do we prove that the HDBSCAN algorithm is effective for finding cointegrated pairs in a trading strategy? Let’s analyze this step by step.
First, as established in earlier articles, HDBSCAN is a density-based clustering algorithm that determines cluster membership by calculating the density of each sample. Its advantages include automatically determining the number of clusters and handling high-dimensional data. Below is the key Python code implementing HDBSCAN, using historical data from January 1, 2022, to December 31, 2023.
start_date = datetime.date(2022, 1, 1)
end_date = datetime.date(2023,12,31)
barss = load_bars(start_date, end_date, 2000) #获取历史资产数据,这里选取2000条数据
closes = barss["close"].unstack().ffill().dropna(axis=1, how='any') #处理缺失值,将close列的MultiIndex转换为DataFrame二维表格,并使用ffill()方法填充缺失值。
clusterer = hdbscan.HDBSCAN(min_cluster_size=3, min_samples=2)# 使用 HDBSCAN 进行聚类,python可以直接安装hdbscan包
cluster_labels = clusterer.fit_predict(closes.T) #转置是因为要对资产(特征)聚类
clustered = closes.T.copy()
clustered['cluster'] = cluster_labels# 将聚类结果添加到 DataFrame 中
clustered = clustered[clustered['cluster'] != -1] # 剔除类别为-1的点,这些是噪声,而不是一个类别
clustered_close = clustered.drop("cluster", axis=1)
unique_clusters = set(cluster_labels)
num_clusters = len(unique_clusters) # 获取有效的簇数量
print(f"有效的簇数量为:{num_clusters}")
tsne = TSNE(n_components=3, random_state=42)
tsne_results = tsne.fit_transform(clustered_close) # 使用t-SNE进行降维,便于后面的簇类可视化
reduced_tsne = pd.DataFrame(data=tsne_results, columns=['tsne_1', 'tsne_2', 'tsne_3'], index=clustered_close.index)# 将t-SNE结果添加到DataFrame中
reduced_tsne['cluster'] = clustered['cluster']
fig_tsne = px.scatter_3d(
reduced_tsne,
x='tsne_1', y='tsne_2', z='tsne_3',
color='cluster',
title='t-SNE Clustering of Stock Returns',
labels={'tsne_1': 't-SNE Component 1', 'tsne_2': 't-SNE Component 2'}
) #进行3D散点图可视化
fig_tsne.layout.width = 1200
fig_tsne.layout.height = 1100
fig_tsne.show()After importing the necessary libraries and running the code, we obtain the following 3D visualization:
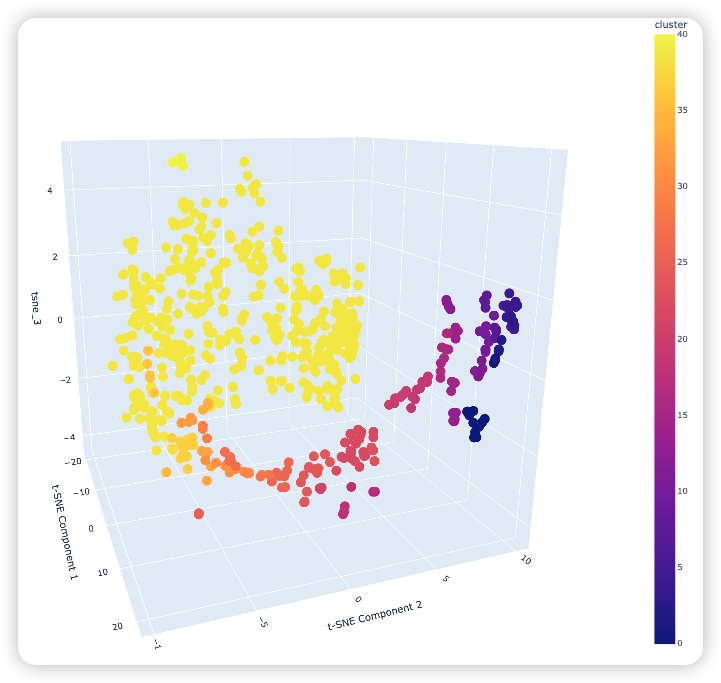
The 3D plot displays the spatial distribution of stocks in three dimensions, with different colors representing distinct clusters. From the visualization, we observe that the 2,000 stocks during this period were divided into over 40 clusters. Aside from Cluster 39, which contains 420 stocks, all other clusters contain fewer than 20 stocks.
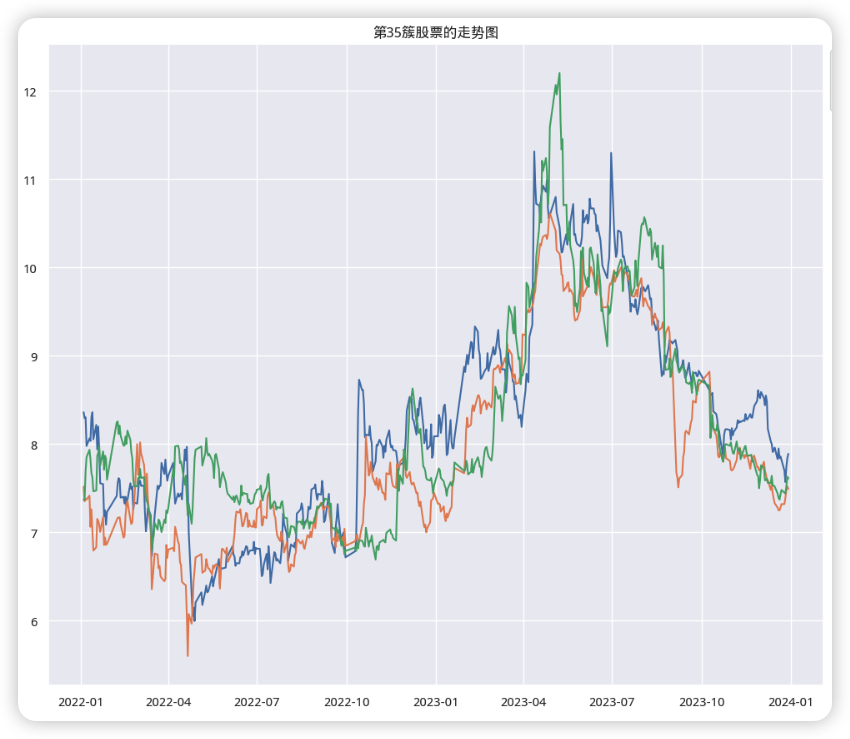
Let’s analyze Cluster 35, which contains three stocks. As shown in the chart below, these three stocks exhibited a sustained upward trend starting around October 1, 2022.
Can we continue using HDBSCAN to cluster data from before October 2022 to see if these three stocks are grouped together? Using the same code but adjusting the time range to January 1, 2022, to October 1, 2022, we obtain the following 3D plot:
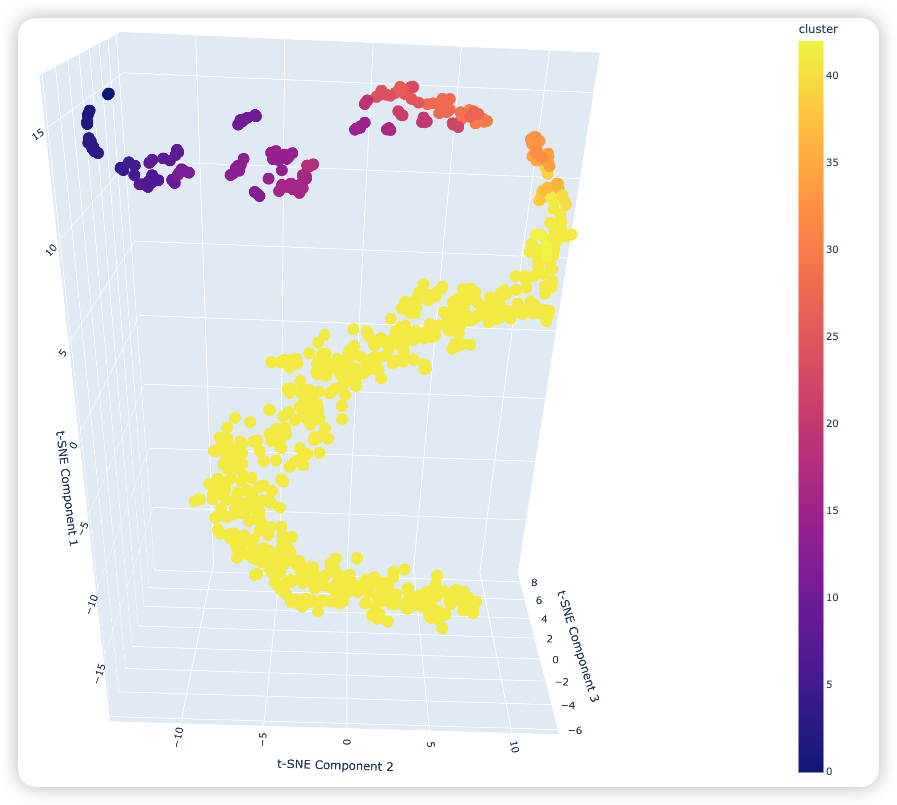
Compared to the previous 3D plot, the stocks (features) grouped into a single cluster are more similar, resulting in denser aggregation. Will the three stocks from Cluster 35 still be grouped together? We can visualize every cluster (using the same method as in the previous article) to observe which cluster these three stocks fall into. Upon inspection, we find that these three stocks are indeed grouped together, but this cluster contains approximately 600 stocks. Let’s examine the visualization for these 600+ stocks:
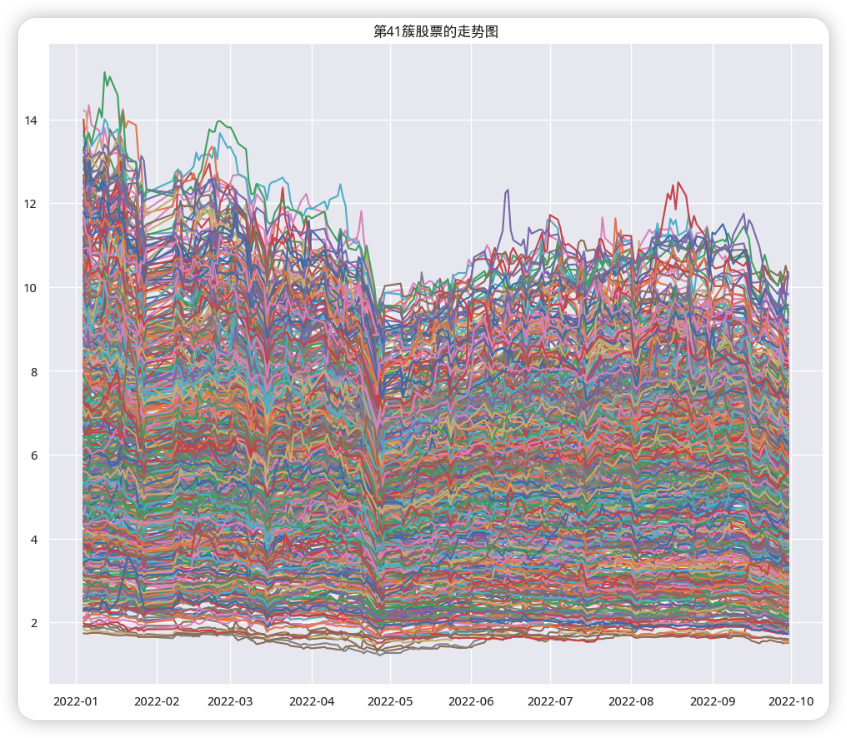
We want to understand what characteristics these three stocks exhibit before their sustained upward trend. Although the data volume for this large cluster is substantial, observing the trend charts reveals that their price movements are roughly identical, which is why they are grouped together.
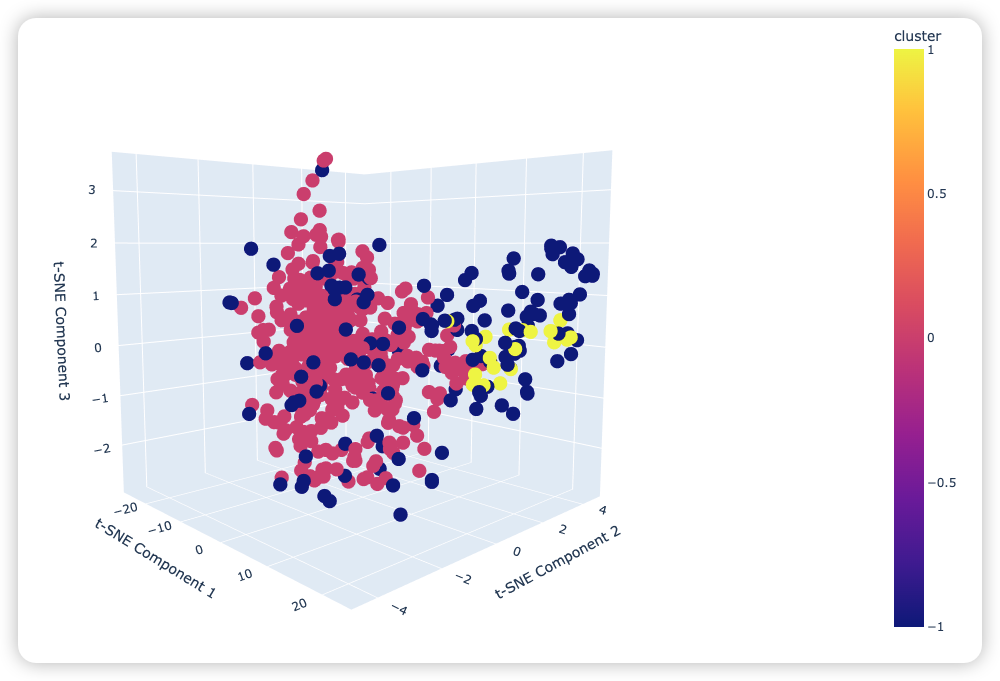
Next, we re-cluster these 600+ stocks using HDBSCAN to see if the original three stocks are grouped together again. This step verifies whether the general trend of the three stocks was consistent before their sustained rise. Interested readers can try this themselves; below are the conclusions from my validation:
When re-clustering these 600 stocks from January 2022 to October 2022, they were divided into three clusters. Two of the original three stocks were grouped together, while the third was in a different cluster. I believe this result sufficiently demonstrates that the trends of these 600 stocks between January 2022 and October 2022 were similar, explaining why they were only divided into three clusters.
Thus, the HDBSCAN algorithm is effective for stock selection. It identifies groups with similar trends, allowing us to use the stationary sequence construction method described in the previous article to generate trading signals.