
IPO Lottery: 5 Quant Strategies for Retail Investors
The recent IPOs of Moore Threads and Meixi Shares have completely ignited the new-stock market. Winning one lot of Moore Threads yields at least 270,000 RMB in profit, while Meixi Shares offers at least 400,000 RMB. Winning both would allow you to retire comfortably for several years. Top retail investors like Ge Weidong have even made billions.
However, as quants, we focus on quantitative matters. Today, we address two key questions: First, if you are lucky enough to win a lottery, at what price should you sell? Second, if you miss out, is there still an opportunity to join the feast?
 Afghanistan Kabul University, Central Library
Step from Amherst, USA, CC BY 2.0
Essentially, this is a valuation problem. If we can determine the fair value of a new stock, making a decision becomes straightforward.
Valuing individual stocks is always difficult, but valuing new stocks is not necessarily so.
The holders of circulating shares in new stocks are primarily institutional investors. Institutions have their own inherent logic for pricing, which makes stock prices relatively deterministic. This is an objective factor that makes stock prices predictable. Only when a phenomenon follows a pattern can we discover it. If stock prices were truly random and uncertain, no method could predict them.
For speculators, there are almost no technical indicators to reference in the price博弈 (game) of new stocks. The only available data are fixed financial indicators and lottery win rates. The relationship between features and returns is likely strong (i.e., low noise), meaning we can potentially find answers through machine learning.
This article will guide you step-by-step through building an IPO lottery prediction model.
- How to obtain new-stock data?
- How to select features?
- Model training and prediction
We also introduce Gemini prompts and its output capabilities in this article.
How to Obtain New-Stock Data?
We can obtain new-stock data from East Money (https://data.eastmoney.com/xg/).
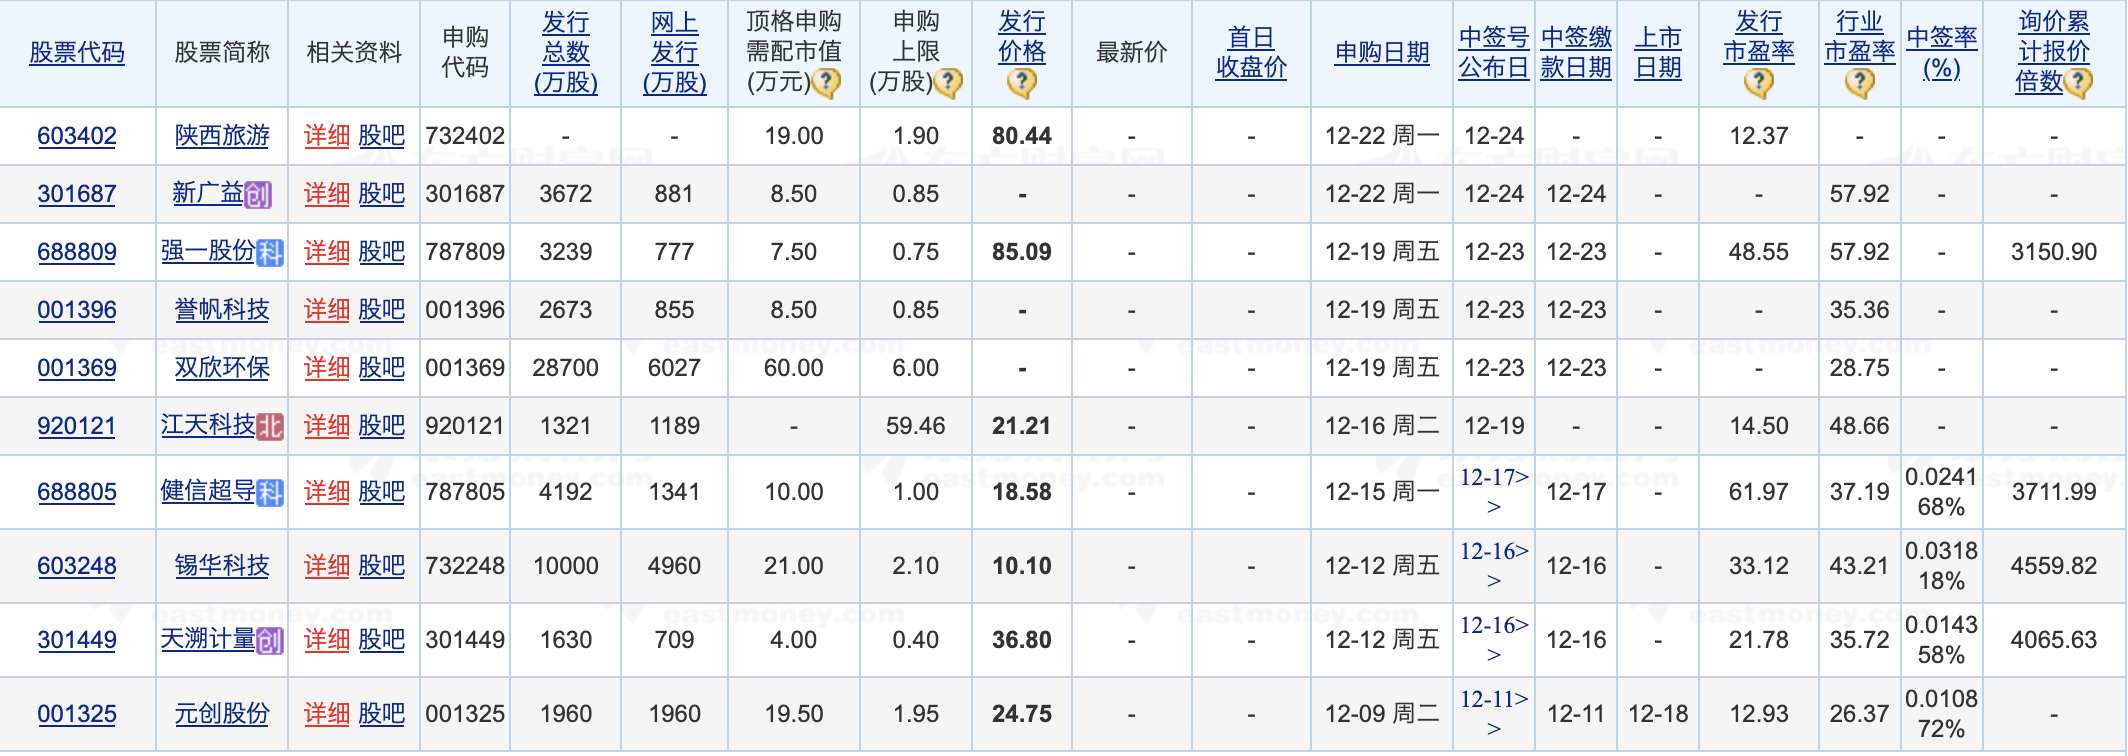
Among these data, we are most concerned with: stock code, stock abbreviation, total issue size, online issue size, market cap required for maximum subscription, subscription limit, issue price, industry P/E ratio, cumulative inquiry quote multiple, number of quote providers, and listing date. Then, we use Tushare to obtain the highest increase over the first 10 trading days after listing, which serves as our prediction label.
The code to scrape the above webpage is as follows:
attention
The complete, runnable code can be found in `src-打新不中.ipynb`. You can download it and run it locally. Just modify the `data_home` variable before running.# Base params
params = {
"reportName": "RPTA_APP_IPOAPPLY",
"columns": "ALL",
"sortColumns": "APPLY_DATE",
"sortTypes": "-1",
"pageSize": "50",
"filter": "",
"source": "WEB",
"client": "WEB"
}
all_data = []
page_num = 1
while True:
print(f"Fetching page {page_num}...")
params["pageNumber"] = str(page_num)
try:
response = httpx.get(url, params=params)
response.raise_for_status()
data = response.json()
if data.get("success") and data.get("result"):
items = data["result"]["data"]
if not items:
print("No more data found.")
break
all_data.extend(items)
total_pages = data["result"]["pages"]
print(f"Page {page_num} fetched. Total pages: {total_pages}")
# Check exit conditions
if page_num >= total_pages:
break
if max_pages and page_num >= max_pages:
print(f"Reached max pages limit ({max_pages}). Stopping.")
break
# Prepare for next page
page_num += 1
# Random delay between 5 to 10 seconds
delay = random.uniform(5, 10)
print(f"Waiting for {delay:.2f} seconds...")
time.sleep(delay)
else:
print(f"Error or no result on page {page_num}: {data.get('message')}")
break
except Exception as e:
print(f"An error occurred on page {page_num}: {e}")
break
if not all_data:
return None
df = pd.DataFrame(all_data)
return df
If you are not familiar with programming, you can ask AI to generate the above code.
Since it scrapes the JSON version, the returned fields are all in English. This is convenient for programming, but we must also understand the meaning of the data to select columns for training features.
## East Money IPO API Parameter Quick Reference (rpta_app_ipoapply)
The code above calls the East Money Data Center API. We have organized the key parameters into a quick reference table for direct reuse:
| Parameter | Value (Example) | Description |
| --- | --- | --- |
| Endpoint | `https://datacenter-web.eastmoney.com/api/data/v1/get` | GET request, returns JSON |
| `reportName` | `RPTA_APP_IPOAPPLY` | New Stock Subscription (IPO Application) dataset |
| `columns` | `ALL` | Fetch all fields; or specify field names as needed |
| `sortColumns` / `sortTypes` | `APPLY_DATE` / `-1` | Sort by subscription date in descending order |
| `pageSize` / `pageNumber` | `50` / Increment from 1 | Paginated fetch; note loop termination conditions |
| `filter` | Empty (or `(APPLY_DATE>='2025-01-01')`) | Server-side filtering to reduce transmission |
| `source` / `client` | `WEB` / `WEB` | Fixed format |
Common associated fields: `listing_date` corresponds to the `上市日期` in the return, used to align with market data for "N-day post-listing return" labels. For valuation queries, you can use the same interface with a different `reportName` (e.g., valuation analysis datasets); the parameter structure is identical.
> Tip: The East Money API occasionally adjusts field names. Confirm the return structure in the browser's developer tools before scraping, then solidify it in your script.
## Which Features Should We Select?
So, I asked AI again:
> Ok, the fields the user cares about are: total issue size, online issue size, market cap required for maximum subscription, subscription limit, issue price, issue P/E ratio, industry P/E ratio, cumulative inquiry quote multiple, number of quote providers, stock code, stock abbreviation, and listing date.<br>
> How do these correspond to the fields in the generated `ipo_data.csv`?
This time, Gemini provided a mapping table:
| Chinese Name | Corresponding API Original Field | Description |
| ---------------- | ------------------------- | ---------------- |
| Stock Code | SECURITY_CODE | - |
| Stock Abbreviation | SECURITY_NAME | - |
| Total Issue Size | TOTAL_ISSUE_NUM | Unit is usually 10,000 shares |
| Online Issue Size | ONLINE_ISSUE_NUM | - |
| Market Cap for Max Subscription | TOP_APPLY_MARKETCAP | Unit is 10,000 RMB |
| Subscription Limit | ONLINE_APPLY_UPPER | Online subscription share limit |
| Issue Price | ISSUE_PRICE | - |
| Issue P/E Ratio | DILUTED_PE_RATIO | Diluted P/E ratio |
| Industry P/E Ratio | INDUSTRY_PE_NEW | - |
| Cumulative Inquiry Quote Multiple | OFFFLINE_INITIAL_MULTIPLE | Offline preliminary inquiry multiple |
| Number of Quote Providers | OFFLINE_EP_OBJECT | Number of offline allocation objects |
| Listing Date | LISTING_DATE | - |
Worried about blind spots in my own thinking, I asked one more question:
> Great. The user plans to build a machine learning model to predict the highest price a new stock can reach within 10 days after listing. Besides the features the user just mentioned, are there any other features in the scraped data that can be used for feature learning? Why might they contribute to predicting returns over the next 10 days?
Gemini's answer was excellent.
## Gemini's Answer
In addition to the fields you have already mentioned (such as issue price, P/E ratio, lottery win rate, etc.), there are several key fields in the scraped data that are very suitable as features for machine learning. They have strong explanatory logic for predicting the performance of new stocks after listing (especially short-term explosive power):
**1. MARKET (Listing Board)**
This is one of the most critical features. Different boards (ChiNext, STAR Market, Main Board, BSE) have different trading rules.
- For example, STAR Market and ChiNext (and the Main Board after registration-based reforms) have no price limits for the first 5 trading days. This directly determines the upper limit of price fluctuation "within 10 days after listing."
- Old Main Board new stocks have a 44% price limit on the first day, followed by 10%.
- Logic: The board directly determines the rules of the game and the risk appetite of capital.
**2. ONLINE_ES_MULTIPLE (Online Effective Subscription Multiple) / ONLINE_ISSUE_LDR (Lottery Win Rate)**
This is the most direct indicator of retail sentiment. The higher the subscription multiple (or the lower the lottery win rate), the higher the market's enthusiasm for the stock, the stronger the reluctance to sell, and the more likely it is to generate a premium in the early stages of listing.
**3. INDUSTRY_NAME (Industry)**
The A-share market has strong sector rotation and track speculation characteristics. New stocks in hot tracks (such as semiconductors, new energy, AI) have much higher valuation tolerance than traditional industries (such as textiles, banking). The industry itself often determines the valuation ceiling.
**4. UNDERWRITER_ORG (Sponsor/Underwriter)**
Projects sponsored by top brokerages ("Three Central and One Hua") are usually screened for quality, and the institutional pricing ability and subsequent stock price maintenance ability may be stronger. The brand endorsement effect of the underwriter and the degree of institutional capital participation.
**5. PROFIT (Net Profit) & NETSUMFINA (Net Assets)**
These two sets of data represent the fundamental quality of the company. Although new stock speculation mainly looks at sentiment, companies with poor fundamentals (especially those listing with losses) fall faster after sentiment fades. These indicators can serve as "safety cushion" features.
**6. PE_DIFF (Valuation Gap - Derived)**
This is a derived data from the original data. Its calculation method: Industry P/E Ratio (`INDUSTRY_PE_NEW`) - Issue P/E Ratio (`DILUTED_PE_RATIO`). This is the core safety margin for IPO profits. If the issue P/E ratio is far below the industry average, it indicates that the issue price is "cheap," and there is strong motivation for the stock price to rebound to the industry average after listing; conversely, there is a risk of breaking the issue price.
I'm really worried about Gemini trading A-shares. He even knows about "Three Central and One Hua," which is terrifying.
## How to Label Data?
Based on the logic we introduced earlier, our strategy will be a regression model, with the label being the highest price a new stock can reach within 10 days after listing. We need to iterate through the data obtained earlier, and for stocks with a `listing date` less than 10 trading days ago, use Tushare to obtain share data and calculate the highest return within 10 days.
This part of the code is relatively simple, so we will skip it. You can generate it with AI. Or subscribe to our research platform membership or Quant 24 Lessons to obtain this strategy.
## Building the Machine Learning Model
Building a machine learning model is actually simple. The harder part is understanding the model and performing appropriate tuning, which is introduced thoroughly in our "Factor Analysis and Machine Learning Strategies" course.
For a basic version, we can let AI generate the code:
> Ok, now please build a regression model based on LightGBM. Stock code, stock abbreviation, and listing date should not be used as features. All others should be used as features. Do features like listing board and industry need to be preprocessed as categorical? Won't LightGBM handle them?
```python
def train_model():
# 1. Load data
df = pd.read_csv(file_path)
# 2. LightGBM can accept features as nan, but does not allow target/label as nan
# So, we need to remove rows where target is nan
df = df.dropna(subset=['上市10日后最高涨幅'])
# 3. When loading data from csv, pandas might get data types wrong. We need to ensure numeric columns are not
# treated as strings -- which would be treated as categorical
numeric_cols_raw = [
'发行总数', '网上发行股数', '总股本', '顶格申购需配市值', '申购上限',
'发行价格', '行业市盈率', '净利润', '净资产',
'网上有效申购倍数', '询价累计报价倍数', '配售对象报价家数'
]
... # Processing method omitted
# 4. Skewness treatment: For these columns, we need to perform logarithmic processing, as their distribution is usually highly skewed
log_candidates = [
'发行总数', '网上发行股数', '总股本', '顶格申购需配市值', '申购上限',
'发行价格', '行业市盈率', '发行市盈率',
'网上有效申购倍数', '询价累计报价倍数', '配售对象报价家数'
]
... # Processing method omitted
# 5. For these columns, we need to convert to categorical variables
... # Processing method omitted
# 6. Build feature matrix X and label vector y
X = df[feature_cols]
y = df['上市10日后最高涨幅']
print(f"Training with {len(feature_cols)} features.")
# 7. Split training and test sets
X_train, X_test, y_train, y_test = train_test_split(X, y, test_size=0.2, random_state=42)
# 8. Train
lgbm = lgb.LGBMRegressor(random_state=42, verbose=-1)
lgbm.fit(X_train, y_train)
# 9. Model evaluation
y_pred = best_model.predict(X_test)
mae = mean_absolute_error(y_test, y_pred)
r2 = r2_score(y_test, y_pred)
print("-" * 30)
print(f"Test MAE: {mae:.4f}")
print(f"Test R2: {r2:.4f}")
print("-" * 30)
# 10. Intuitive display
print("\nTop 5 Test Cases (Actual vs Predicted):")
# Let's take first 5 from the test set
sample_indices = y_test.index[:5]
for idx in sample_indices:
actual = y_test.loc[idx]
# Predict expects a DataFrame
predicted = best_model.predict(X.loc[[idx]])[0]
stock_code = df.loc[idx, '股票代码']
stock_name = df.loc[idx, '股票简称']
print(f"Code: {stock_code}, Name: {stock_name}")
print(f" Actual: {actual:.4f} ({actual*100:.2f}%)")
print(f" Pred : {predicted:.4f} ({predicted*100:.2f}%)")
print(f" Diff : {predicted-actual:.4f}")
print("-" * 20)
# 11. Show feature interpretability
print("\nTop 20 Feature Importances:")
importances = pd.DataFrame({
'feature': feature_cols,
'importance': best_model.feature_importances_
}).sort_values('importance', ascending=False)
print(importances.head(20))The training results are as follows:
Test MAE: 0.4096
Test R2: 0.4749
------------------------------
Top 5 Test Cases (Actual vs Predicted):
Code: 2715, Name: Dengyun Shares
Actual: 1.8061 (180.61%)
Pred : 0.6291 (62.9
# Optimizing IPO Alpha Models: Regime Features & Hyperparameter Tuning
This article details the optimization of an IPO alpha model, demonstrating how adding market regime features and rigorous hyperparameter tuning with LightGBM significantly improves predictive accuracy and R-squared scores for China A-share IPO returns.
**Tags:** IPO Alpha, LightGBM, Feature Engineering, Quantitative Strategy
## Result Optimization
Many practitioners approach hyperparameter tuning from a pure machine learning perspective, relying on methods like `GridSearchCV` and `RandomizedSearchCV` to search for optimal parameters. While these are standard ML techniques and can be effective, they are not the primary drivers of model validity.
For instance, the initial listing surge of new stocks is heavily dependent on recent market conditions. Therefore, we should incorporate features representing the returns of new stocks over the past week, month, and three months. We refer to this feature as **Market Regime**.
Adding these features increased the $R^2$ value. The sampled test data is as follows:
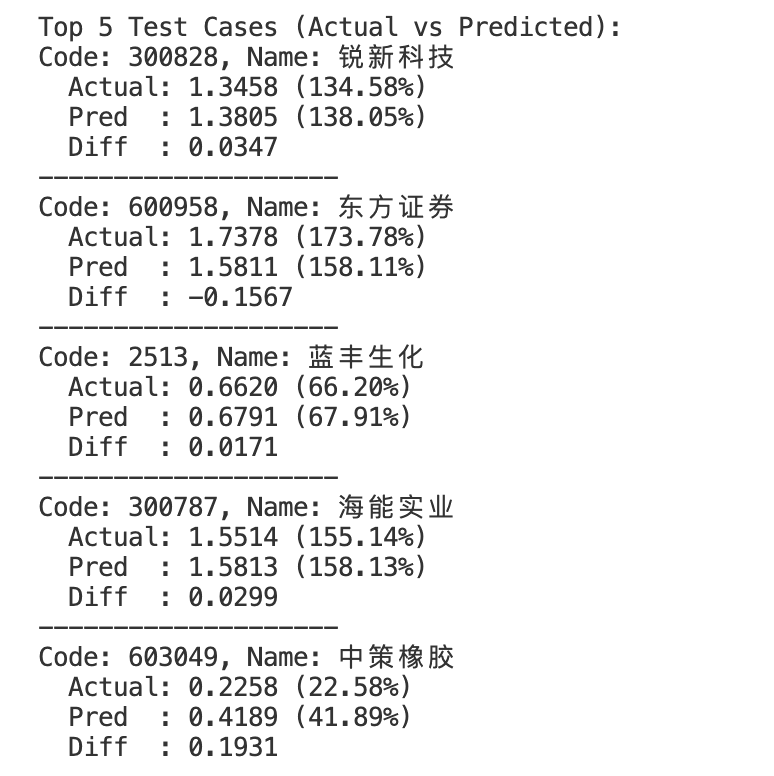
The results are quite promising. Take Ruixin Technology (锐新科技) as an example: its actual surge reached 134.85%, while the prediction error was only around 4%, which is remarkably accurate.
On the other hand, the most significant factor affecting model validity may be the excessively long time span of the dataset. During this period, the IPO system in China A-shares underwent multiple reforms, resulting in data that contains different IPO rules and mechanisms. Consequently, the historical data used for training may differ significantly from current realities. Training on such a long, heterogeneous dataset lacks logical justification and ultimately degrades model performance.
Additionally, we used data from the first 10 days post-listing as the label. If we restrict the time horizon to 5 or 3 days, the prediction error might be smaller. However, the model's actual arbitrage capability could also diminish under such a short window.
This part of the work is left for the reader to explore. As serious quantitative finance bloggers, we believe that disseminating methods and thought processes is far more valuable than providing a final, static model.
The complete source code for this article can be obtained from the [Quantide Research Platform](http://ke.quantide.cn) or the course *Factor Analysis and Machine Learning Strategies*.
```python
# fetch_ipo.py
import json
import os
import random
import time
from datetime import datetime, timedelta
import httpx
import pandas as pd
import tushare as ts
def get_tushare_api():
try:
# User specified that set_token is not needed in this environment
return ts.pro_api()
except Exception as e:
print(f"Error initializing Tushare API: {e}")
return None
def to_ts_code(stock_code):
"""
Convert stock code to Tushare format (e.g., 600000 -> 600000.SH)
"""
if not stock_code:
return None
stock_code = str(stock_code)
if stock_code.startswith('6'):
return f"{stock_code}.SH"
elif stock_code.startswith('0') or stock_code.startswith('3'):
return f"{stock_code}.SZ"
elif stock_code.startswith('8') or stock_code.startswith('4') or stock_code.startswith('9'):
return f"{stock_code}.BJ"
else:
return stock_code
def get_ipo_data(max_pages=None):
"""
Fetch IPO data from Eastmoney with pagination.
Args:
max_pages (int, optional): Maximum number of pages to fetch. If None, fetch all.
Returns:
pandas.DataFrame: Combined data from all fetched pages.
"""
url = "https://datacenter-web.eastmoney.com/api/data/v1/get"
# Base params
params = {
"reportName": "RPTA_APP_IPOAPPLY",
"columns": "ALL",
"sortColumns": "APPLY_DATE",
"sortTypes": "-1",
"pageSize": "50",
"filter": "",
"source": "WEB",
"client": "WEB"
}
all_data = []
page_num = 1
while True:
print(f"Fetching page {page_num}...")
params["pageNumber"] = str(page_num)
try:
response = httpx.get(url, params=params)
response.raise_for_status()
data = response.json()
if data.get("success") and data.get("result"):
items = data["result"]["data"]
if not items:
print("No more data found.")
break
all_data.extend(items)
total_pages = data["result"]["pages"]
print(f"Page {page_num} fetched. Total pages: {total_pages}")
# Check exit conditions
if page_num >= total_pages:
break
if max_pages and page_num >= max_pages:
print(f"Reached max pages limit ({max_pages}). Stopping.")
break
# Prepare for next page
page_num += 1
# Random delay between 5 to 10 seconds
delay = random.uniform(5, 10)
print(f"Waiting for {delay:.2f} seconds...")
time.sleep(delay)
else:
print(f"Error or no result on page {page_num}: {data.get('message')}")
break
except Exception as e:
print(f"An error occurred on page {page_num}: {e}")
break
if not all_data:
return None
df = pd.DataFrame(all_data)
# Select and rename important columns
columns_map = {
"SECURITY_CODE": "股票代码",
"SECURITY_NAME": "股票简称",
"TOTAL_ISSUE_NUM": "发行总数",
"ONLINE_ISSUE_NUM": "网上发行股数",
"TOP_APPLY_MARKETCAP": "顶格申购需配市值",
"ONLINE_APPLY_UPPER": "申购上限",
"ISSUE_PRICE": "发行价格",
"DILUTED_PE_RATIO": "发行市盈率",
"INDUSTRY_PE_NEW": "行业市盈率",
"OFFFLINE_INITIAL_MULTIPLE": "询价累计报价倍数",
"OFFLINE_EP_OBJECT": "配售对象报价家数",
"LISTING_DATE": "上市日期",
"MARKET": "上市板块",
"ONLINE_ES_MULTIPLE": "网上有效申购倍数",
"INDUSTRY_NAME": "所属行业",
"UNDERWRITER_ORG": "保荐机构",
"TOTAL_SHARES": "总股本",
"PROFIT": "净利润",
"NETSUMFINA": "净资产"
}
# Rename columns that exist
df = df.rename(columns=columns_map)
# Calculate Valuation Difference (PE Diff)
# Ensure numeric types
if "发行市盈率" in df.columns and "行业市盈率" in df.columns:
df['发行市盈率'] = pd.to_numeric(df['发行市盈率'], errors='coerce')
df['行业市盈率'] = pd.to_numeric(df['行业市盈率'], errors='coerce')
df['估值差'] = df['行业市盈率'] - df['发行市盈率']
return df
def analyze_ipo_performance(df):
"""
Calculate max price increase within 10 days of listing using Tushare.
"""
pro = get_tushare_api()
if not pro:
print("Skipping Tushare analysis due to missing token.")
return df
print("Starting Tushare analysis...")
# Add new column
df['上市10日后最高涨幅'] = None
# Filter for listed stocks
# Ensure Listing Date is datetime
# Note: Eastmoney might return dates as strings "YYYY-MM-DD HH:MM:SS" or similar
for index, row in df.iterrows():
listing_date_str = row.get('上市日期')
stock_code = row.get('股票代码')
issue_price = row.get('发行价格')
if not listing_date_str or not stock_code or pd.isna(issue_price):
continue
try:
# Parse listing date (assuming format "YYYY-MM-DD ...")
if isinstance(listing_date_str, str):
listing_date = datetime.strptime(listing_date_str.split(' ')[0], "%Y-%m-%d")
else:
continue
# Skip if listing date is in future
if listing_date > datetime.now():
continue
# Check if listing date is less than 14 days from now (10 trading days approx)
# If so, the observation window is incomplete, so we skip calculation.
days_since_listing = (datetime.now() - listing_date).days
if days_since_listing < 14:
print(f"Skipping {stock_code}: Listed less than 14 days ago ({days_since_listing} days).")
continue
# Calculate end date (Listing Date + 14 days to cover 10 trading days)
end_date = listing_date + timedelta(days=14)
start_date_str = listing_date.strftime("%Y%m%d")
end_date_str = end_date.strftime("%Y%m%d")
ts_code = to_ts_code(stock_code)
# Fetch daily data
# We need to respect Tushare rate limits (usually 200 calls/min for free users?)
# Let's add a small delay
# time.sleep(0.3)
daily_df = pro.daily(ts_code=ts_code, start_date=start_date_str, end_date=end_date_str)
if daily_df is not None and not daily_df.empty:
max_high = daily_df['high'].max()
if max_high and issue_price > 0:
max_increase = (max_high - issue_price) / issue_price
df.at[index, '上市10日后最高涨幅'] = max_increase
print(f"Processed {ts_code}: Max High {max_high}, Issue {issue_price}, Increase {max_increase:.2%}")
else:
print(f"No daily data for {ts_code}")
except Exception as e:
print(f"Error processing {stock_code}: {e}")
return df
if __name__ == "__main__":
print("Starting IPO data fetch ...")
df = get_ipo_data()
if df is not None:
print(f"Successfully fetched {len(df)} records.")
# Analyze performance
df = analyze_ipo_performance(df)
# Save to CSV
output_path = os.path.join(os.path.dirname(os.path.abspath(__file__)), "ipo_data.csv")
# Save only the columns requested by user + performance
desired_cols = [
"股票代码", "股票简称", "上市板块", "所属行业", "保荐机构",
"发行总数", "网上发行股数", "总股本",
"顶格申购需配市值", "申购上限",
"发行价格", "发行市盈率", "行业市盈率", "估值差",
"净利润", "净资产",
"网上有效申购倍数", "询价累计报价倍数", "配售对象报价家数",
"上市日期", "上市10日后最高涨幅"
]
# Filter existing columns
existing_cols = [c for c in desired_cols if c in df.columns]
df_to_save = df[existing_cols]
df_to_save.to_csv(output_path, index=False, encoding='utf-8-sig')
print(f"Data saved to {output_path}")
# Display sample
pd.set_option('display.max_columns', None)
pd.set_option('display.width', 1000)
# Show rows where Listing Date is not null to verify logic
if "上市日期" in df.columns:
print(df_to_save[df_to_save['上市日期'].notna()].head())# train.py
import datetime
import os
import warnings
import lightgbm as lgb
import numpy as np
import pandas as pd
from sklearn.metrics import mean_absolute_error, r2_score
from sklearn.model_selection import RandomizedSearchCV, train_test_split
# Suppress warnings
warnings.filterwarnings('ignore')
def train_model(start: datetime.date = None):
# 1. Load Data
file_path = os.path.join(os.path.dirname(__file__), 'ipo_data.csv')
if not os.path.exists(file_path):
print(f"Error: {file_path} not found.")
return
print(f"Loading data from {file_path}...")
df = pd.read_csv(file_path)
# 2. Preprocessing
# Filter out rows with missing target
if start is not None:
df = df.query(f"上市日期 >= '{start.isoformat()}'")
df = df.dropna(subset=['上市10日后最高涨幅'])
print(f"Data size after dropping missing targets: {len(df)}")
# Ensure numeric columns are actually numeric
numeric_cols_raw = [
'发行总数', '网上发行股数', '总股本', '顶格申购需配市值', '申购上限',
'发行价格', '行业市盈率', '净利润', '净资产',
'网上有效申购倍数', '询价累计报价倍数', '配售对象报价家数'
]
for col in numeric_cols_raw:
if col in df.columns:
df[col] = pd.to_numeric(df[col], errors='coerce')
# Reconstruct Issue PE if missing or empty
# Issue PE = Issue Price / (Net Profit / Total Shares)
if '发行市盈率' not in df.columns or df['发行市盈率'].isnull().all():
print("Reconstructing '发行市盈率' (Issue PE)...")
# Avoid division by zero
df['calculated_eps'] = df['净利润'] / df['总股本']
df['发行市盈率'] = df.apply(
lambda row: row['发行价格'] / row['calculated_eps'] if row['calculated_eps'] > 0 else np.nan,
axis=1
)
else:
df['发行市盈率'] = pd.to_numeric(df['发行市盈率'], errors='coerce')
# Calculate Valuation Difference
if '估值差' not in df.columns or df['估值差'].isnull().all():
if '行业市盈率' in df.columns and '发行市盈率' in df.columns:
print("Calculating '估值差' (Valuation Difference)...")
df['估值差'] = df['行业市盈率'] - df['发行市盈率']
# --- New Feature: Market Regime (Past IPO Performance) ---
print("Calculating Market Regime features (1w, 1m, 3m)...")
if '上市日期' in df.columns and '上市10日后最高涨幅' in df.columns:
df['上市日期'] = pd.to_datetime(df['上市日期'], errors='coerce')
# Sort by date to ensure chronological order (helper for debugging, not strictly needed for logic)
df = df.sort_values('上市日期').reset_index(drop=True)
# Define lookback windows in days
windows = {
'market_regime_1w': 7,
'market_regime_1m': 30,
'market_regime_3m': 90
}
# Prepare arrays for faster iteration
dates = df['上市日期'].values
targets = df['上市10日后最高涨幅'].values
# Dictionary to store results
new_features = {k: np.full(len(df), np.nan) for k in windows.keys()}
for i in range(len(df)):
current_date = dates[i]
if pd.isnull(current_date):
continue
for feat_name, days in windows.items():
cutoff_date = current_date - np.timedelta64(days, 'D')
# Filter: listed within [current_date - days, current_date)
# strictly less than current_date to avoid data leakage
mask = (dates >= cutoff_date) & (dates < current_date)
# Only calculate if we have samples
if np.any(mask):
# Ignore NaNs in the target when calculating mean
vals = targets[mask]
valid_vals = vals[~np.isnan(vals)]
if len(valid_vals) > 0:
new_features[feat_name][i] = np.mean(valid_vals)
# Add to DataFrame
for k, v in new_features.items():
df[k] = v
# Log transform for strictly positive skewed features
# We create NEW columns for these to let the model choose
log_candidates = [
'发行总数', '网上发行股数', '总股本', '顶格申购需配市值', '申购上限',
'发行价格', '行业市盈率', '发行市盈率',
'网上有效申购倍数', '询价累计报价倍数', '配售对象报价家数'
]
for col in log_candidates:
if col in df.columns:
# Create a new feature with log prefix
# Use log1p to handle zeros/small numbers
# We filter for > 0 to avoid errors
df[f'log_{col}'] = df[col].apply(lambda x: np.log1p(x) if pd.notnull(x) and x > 0 else np.nan)
# Categorical Features
cat_cols = ['上市板块', '所属行业', '保荐机构']
for col in cat_cols:
if col in df.columns:
df[col] = df[col].astype('category')
# Select Features
# Exclude non-predictive or target columns
exclude_cols = ['股票代码', '股票简称', '上市日期', '上市10日后最高涨幅', 'calculated_eps']
# We use all remaining columns as features
feature_cols = [c for c in df.columns if c not in exclude_cols]
X = df[feature