
A-Share Slope Momentum Factor: 10-Day Regression Backtest
The slope factor is a variant of the momentum factor, first introduced by Andreas F. Clenow in his book, Stocks on the Move: Beating the Market with Hedge Fund Momentum Strategy.
This factor aligns more closely with human intuition than the Carhart momentum factor, particularly appealing to investors who rely on candlestick charts (K-lines). Consequently, it has garnered significant attention, with discussions appearing on platforms like Quantopian and QuantConnect.
tip
Let us briefly review the momentum factor proposed by Mark Carhart. It calculates the one-year return of individual stocks, excluding the most recent month to prevent price manipulation effects. Stocks are then ranked by return; the top 10% serve as buy signals, while the bottom 10% serve as sell signals.However, the factor tested in this article uses the regression slope over the past 10 days as the momentum signal. The primary goal is to explore new possibilities, considering that in China A-shares, the half-life of momentum factors is generally short.
Our calculation method is shown in the following code:
def moving_slope(close: NDArray, win:int, *args):
# Create a sliding window view
shape = (win, close.size - win + 1)
strides = (close.itemsize, close.itemsize)
cw = np.lib.stride_tricks.as_strided(close,
shape=shape,
strides=strides)
# Apply linregress to each window to obtain the slope
x = np.arrange(win)
slopes = np.apply_along_axis(lambda y: linregress(x, y)[0],
axis=0, arr=cw)
return slopes
The testing parameters are as follows: We randomly selected 2,000 stocks and tested from January 4 to July 31 of this year. The regression slope was calculated using the closing prices of the past 10 days, while returns were calculated using the opening price starting from the next day.
The factor layering results are as follows:
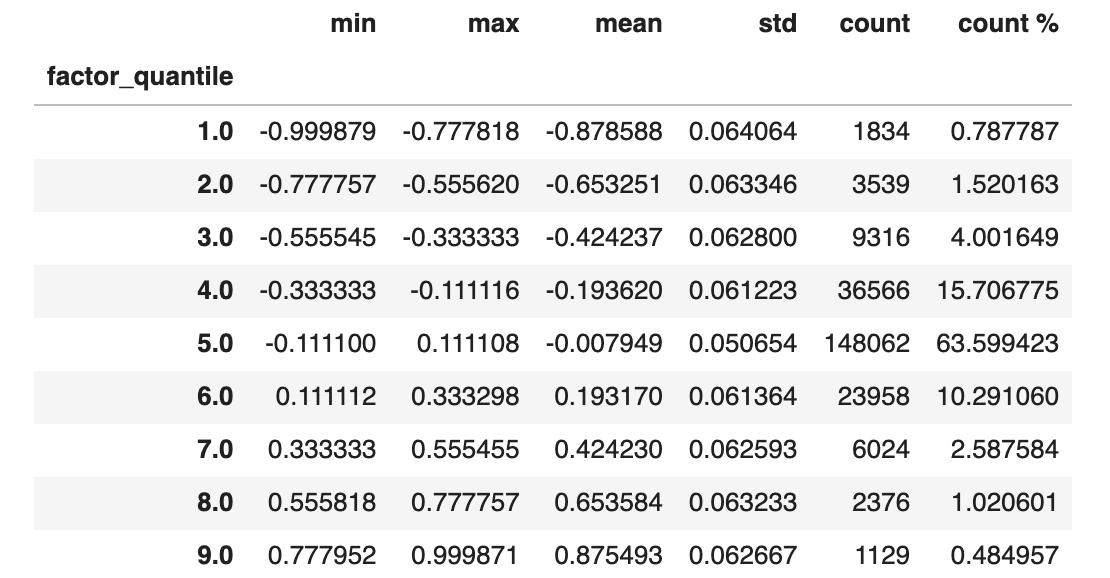
The mean returns by layer are shown below:
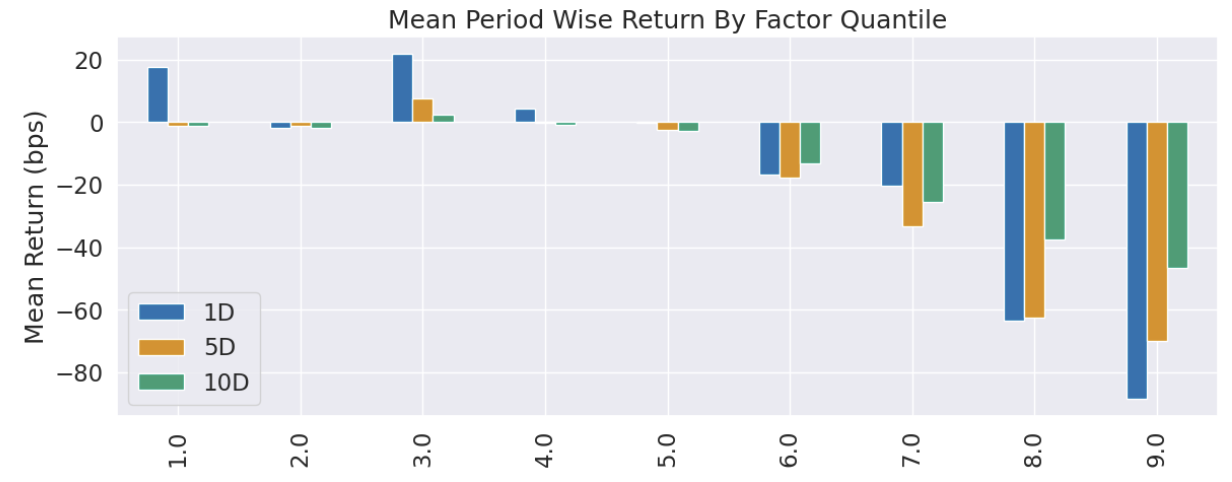
Clearly, the 10-period slope factor acts as a contrarian indicator: the faster the short-term rise, the greater the loss after buying.
Given this, we take the negative of the slope factor as the new signal and run the test again:
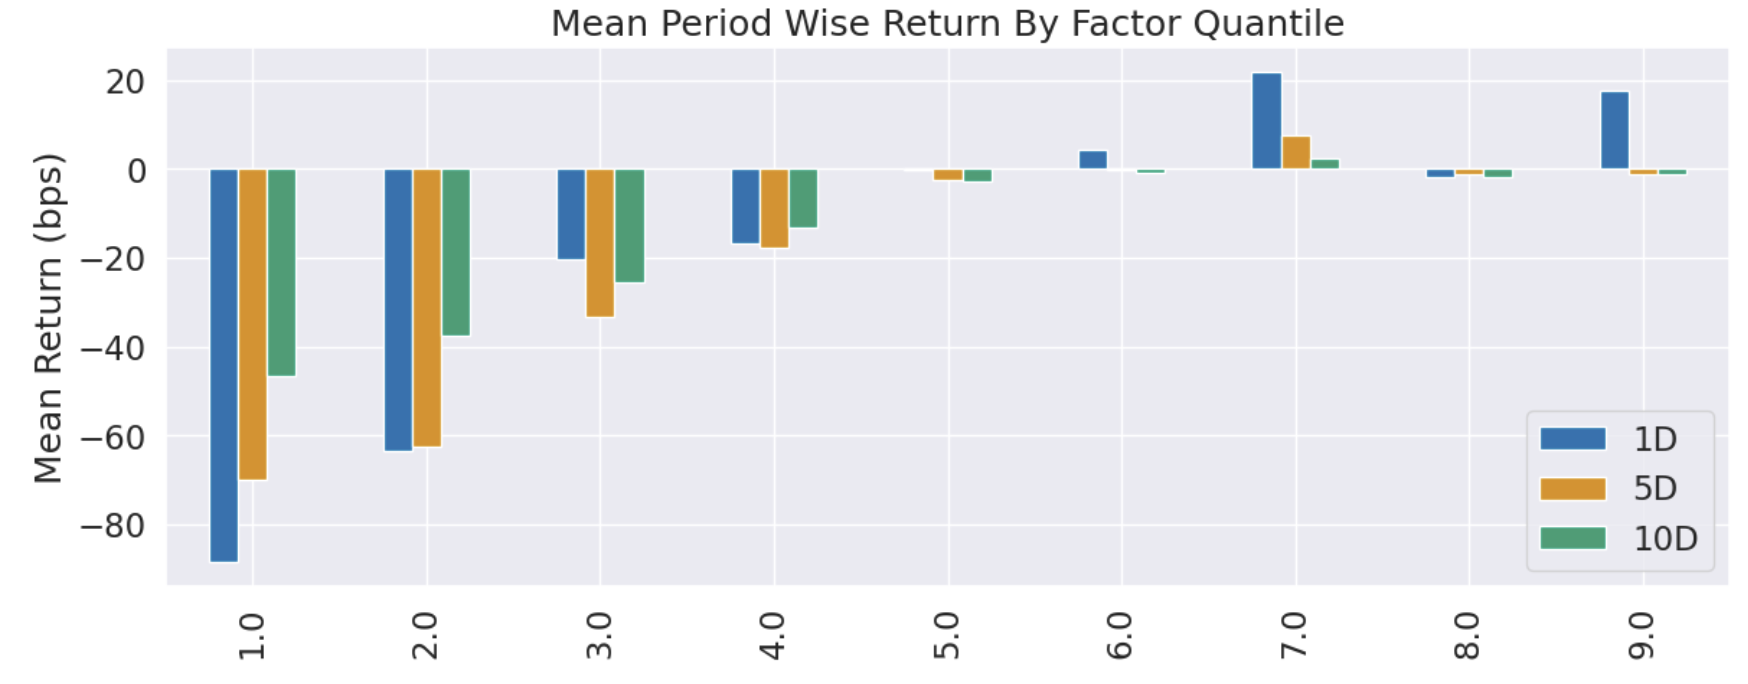
As expected, this chart is merely a mirror image of the previous one. Let us examine the returns:
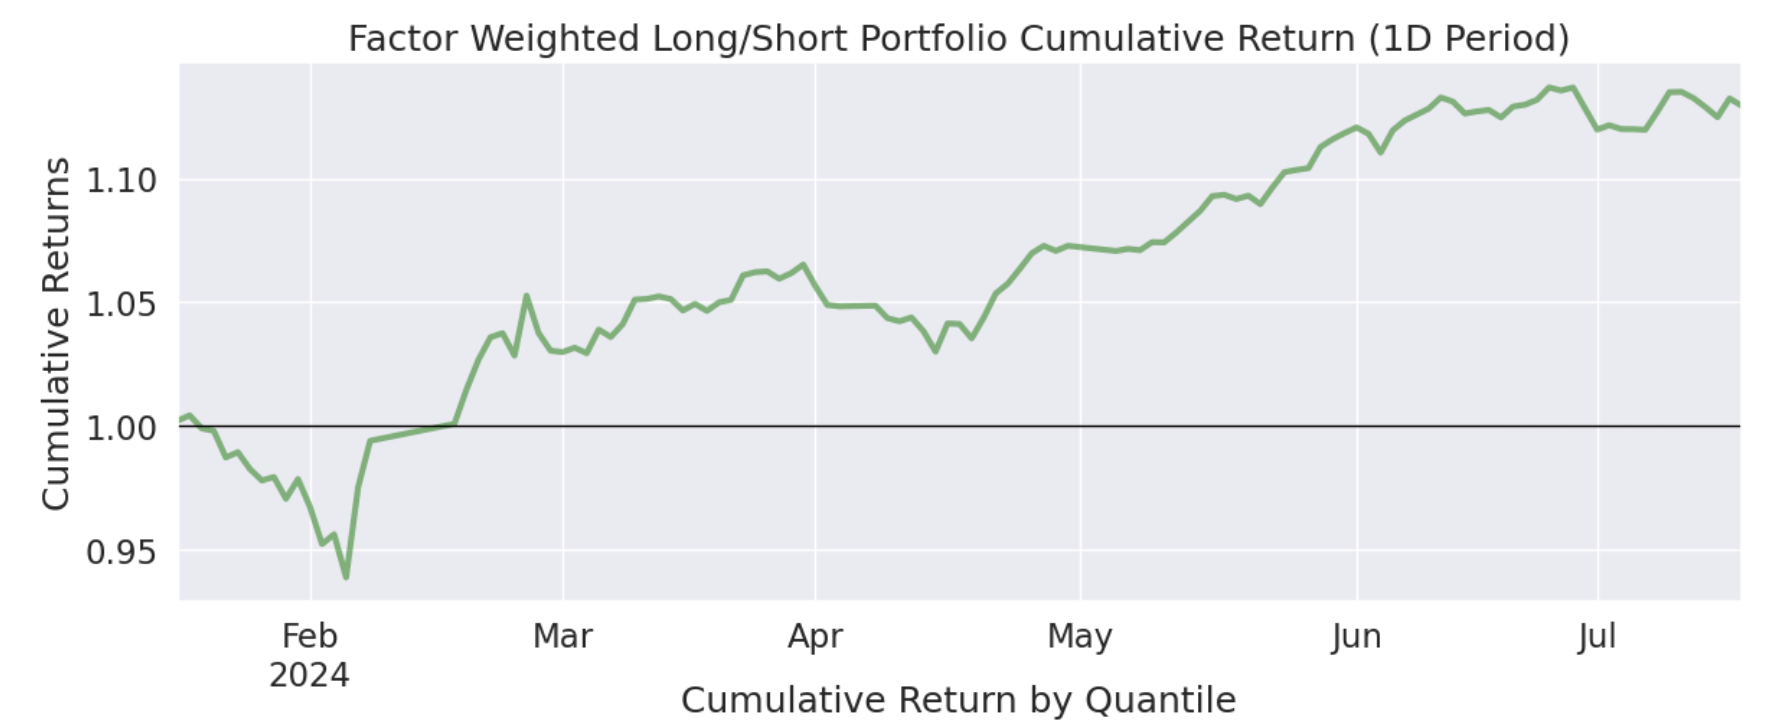
The cumulative return over seven months approaches 15%, with a maximum drawdown of around 5%. Considering the performance this year, the results are decent.
tip
In the previous RSI factor test, we made some minor adjustments to the factor composition. Some readers argued that the improved data after tweaking indicated overfitting. When writing this factor today, I recalled that in Alpha101, they discarded the top n% of momentum factors as a correction. Being vigilant against overfitting is correct, but improved data does not automatically imply overfitting.Looking deeper into the cumulative returns by layer:
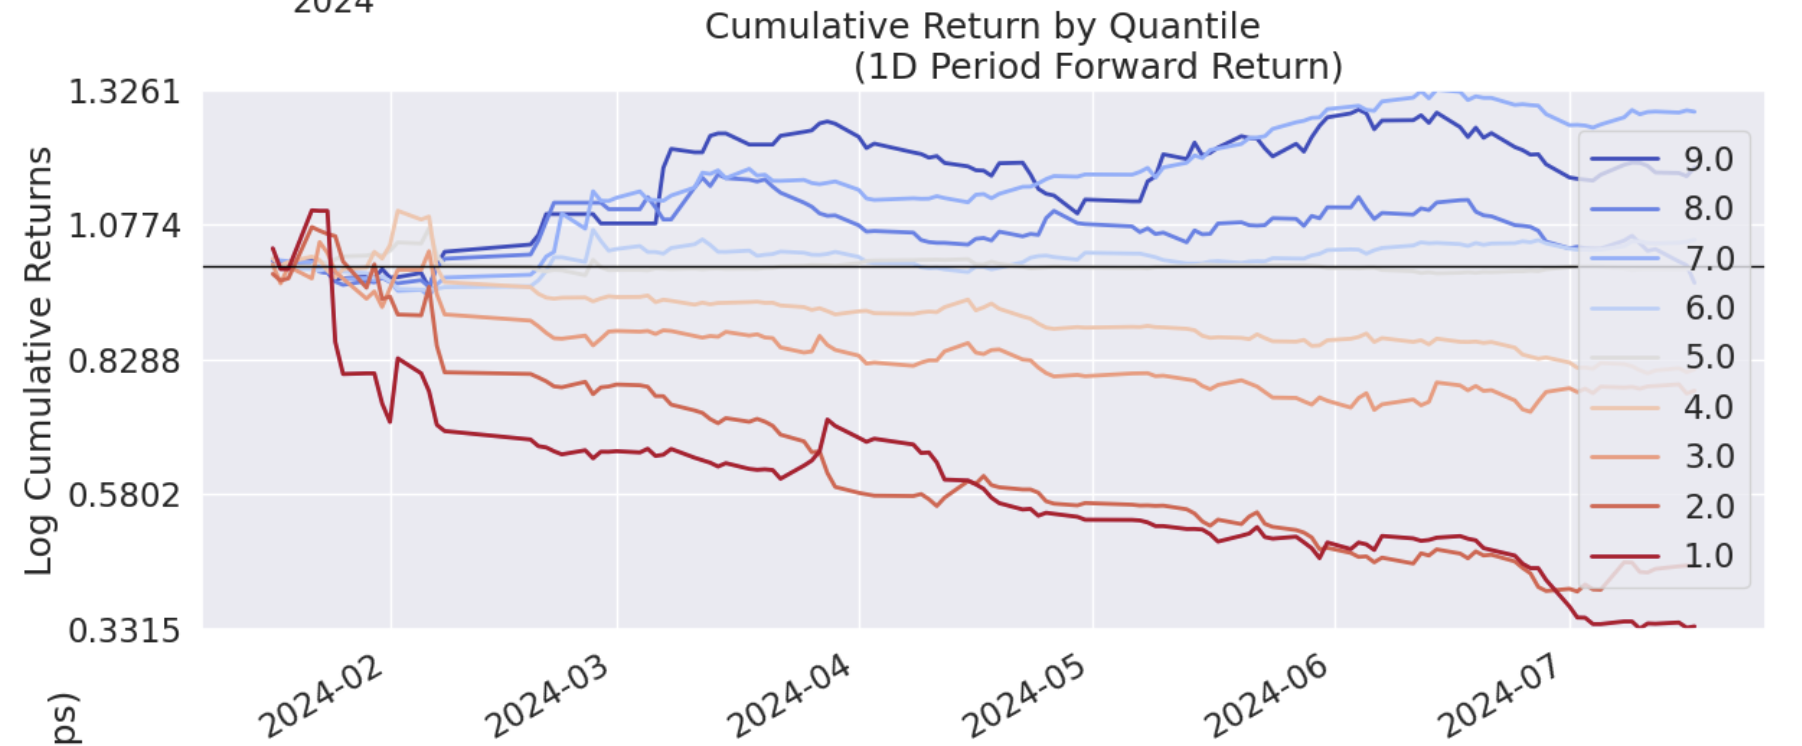
The factor demonstrates good stability, with no significant style shifts occurring during the period.
However, if this factor were to be deployed in live trading, it might not be suitable for individual investors or small-to-medium institutions. As the layering chart suggests, its returns are primarily generated from short positions.
What would the performance look like without the ability to short? The following chart shows the returns under a long-only strategy:
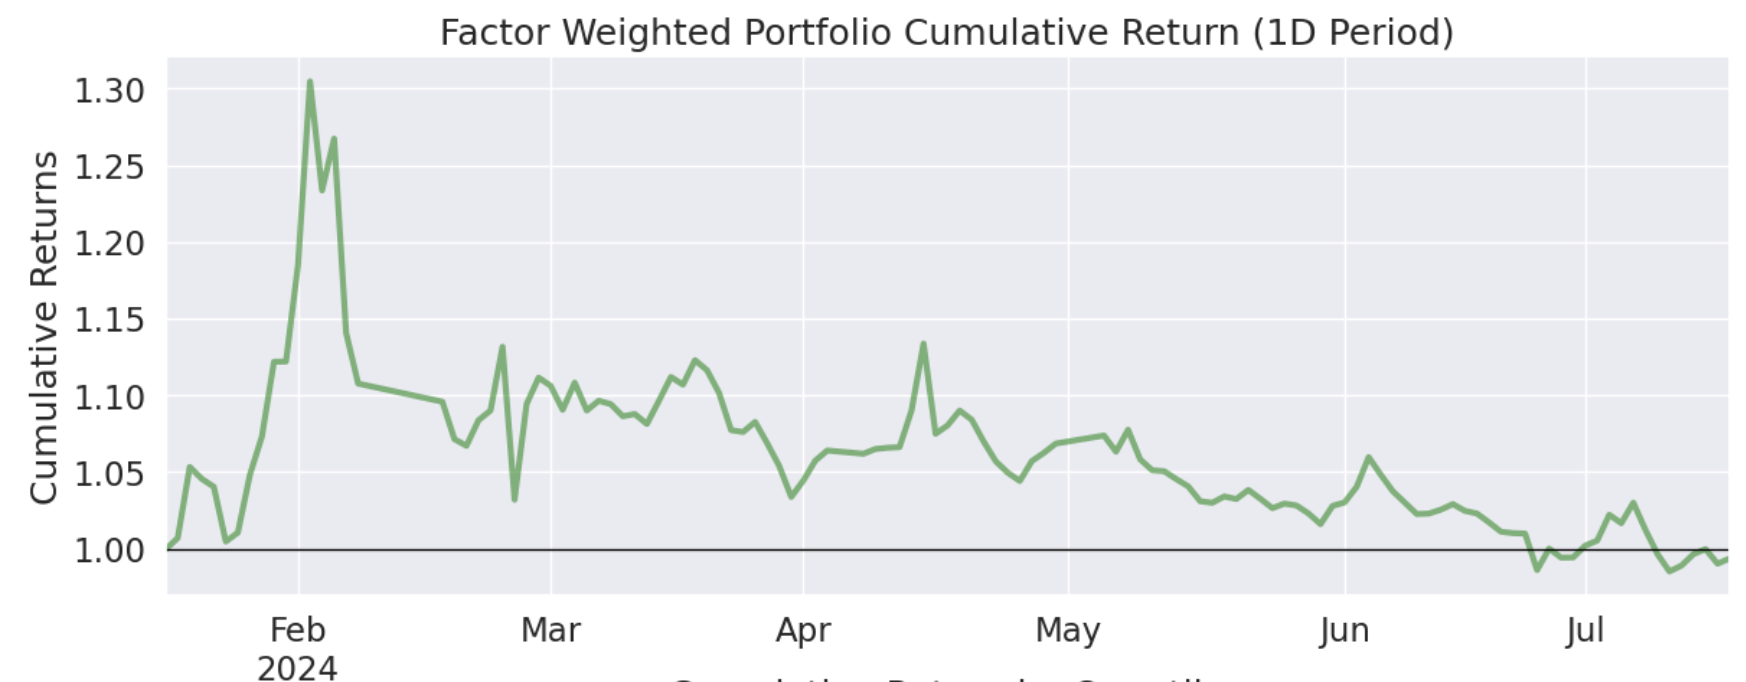
This performance is not surprising. There was a strong rebound in February, during which the factor performed well. However, as the market weakened subsequently, the half-life of the momentum factor shortened, and the long-only returns declined steadily.

On the cusp of July and August, China A-shares experienced a bull market spanning two months, lasting 86,400 seconds. It has since re-entered a hibernation state. This phenomenon may not be predictable using the momentum factor introduced today, but the factor’s weak performance does help explain why a continuous rally did not materialize.
Another conclusion is that because short-selling yields are relatively certain, prices are easier to drop than to rise. With the departure of Chairman Fang, let us see if changes can be made to short-selling mechanisms. After all, only a minority of institutions can short. The system should be fair to all participants.
The image on the left is from Andreas Clenow’s book, Stocks on the Move: Beating the Market with Hedge Fund Momentum Strategy. Andreas Clenow is a Swedish-Swiss author, asset manager, and entrepreneur, currently residing in Zurich, where he serves as Chief Investment Officer at a family office. Throughout his illustrious career, he has been a tech entrepreneur, financial advisor, hedge fund manager, financial engineer, quantitative trader, financial consultant, board member, and corporate middle-management bureaucrat.
In this book, Clenow details the principles of momentum strategies: buying stocks that have performed well in the past and selling or shorting those that have performed poorly, leveraging the persistence of market trends to profit. The book compares the application of technical and fundamental analysis in momentum strategies and discusses how to combine their advantages to improve trading outcomes.