
Pandas Core Syntax Part 3: DataFrame Creation, Merging, and Manipulation
“DataFrames are the core data structure in Pandas, supporting various data types and flexible operations. Whether converting nested dictionaries, NumPy arrays, or CSV files, DataFrames enable rapid data analysis tasks.”
1. Rapidly Exploring DataFrames
1.1. Creating DataFrames
A DataFrame consists of ordered, named columns where each column can hold different data types (numeric, string, boolean, etc.). It features both row and column indices, functioning essentially as a dictionary of Series sharing the same index. Although two-dimensional, DataFrames can represent higher-dimensional tabular data using hierarchical indexing. If you are using a Jupyter notebook, Pandas DataFrames will render as HTML tables optimized for browser viewing.
1.1.1. Creating from a Dictionary of Equal-Length Lists or NumPy Arrays
import pandas as pd
data = {"state":["Ohio","Ohio","Ohio","Nevada","Nevada","Nevada"],
"year":[2000,2001,2002,2003,2004,2005],
"pop":[1.5,1.7,3.6,2.4,2.9,3.2]}
frame = pd.DataFrame(data)
frame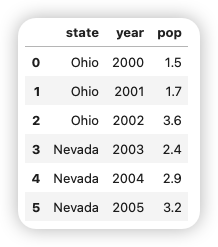
The generated DataFrame automatically assigns an index (similar to Series) and orders all columns according to the order of keys in the input dictionary (determined by insertion order). (Note: In Jupyter notebooks, Pandas DataFrames render as browser-friendly HTML tables.)
For very large DataFrames, use the head method to display only the first five rows. Similarly, the tail method returns the last five rows.
print(frame.head())
print(frame.tail())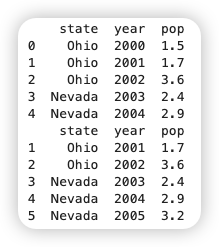
Below are additional methods for creating DataFrames:
# 如果指定了列的顺序,则DataFrame的列就会按照指定顺序进行排列
frame1 = pd.DataFrame(data=data,columns=["year","state","pop"])
# 如果字典中不包括传入的列,就会在结果中产生缺失值
frame2 = pd.DataFrame(data=data,columns=["year","state","pop","debt"])1.1.2. Creating from Nested Dictionaries
When passing a nested dictionary to a DataFrame, Pandas interprets the outer dictionary’s keys as column names and the inner dictionary’s keys as row indices.
populations = {"Ohio":{2000:1.5,2001:1.7,2002:3.6},"Nevada":{2001:2.4,2002:2.9}}
frame3 = pd.DataFrame(populations)
frame3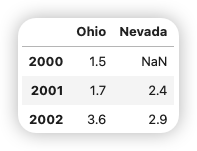
You can transpose a DataFrame (swapping rows and columns) using methods similar to those for NumPy arrays:
frame3.T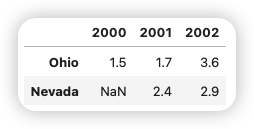
The keys from the inner dictionaries are merged to form the resulting index. This behavior does not occur if an explicit index is specified:
pd.DataFrame(populations,index=["2001","2002","2003"])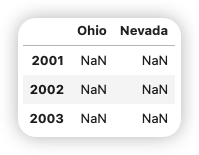
Dictionaries composed of Series follow a similar usage pattern:
pdata = {"Ohio":frame3["Ohio"][:-1],"Nevada":frame3["Nevada"][:2]}
pd.DataFrame(pdata)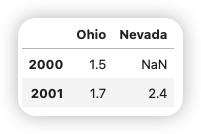
Data types that can be passed to the DataFrame constructor:
| Type | Description |
|---|---|
| Dictionary (Dict) | Keys are column names; values are lists, NumPy arrays, or Series. Column lengths must match. |
| List (List) | Each element is a dictionary where keys are column names and values are column data. |
| NumPy Array | 2D array where rows correspond to DataFrame rows and columns to DataFrame columns. |
| Series | A single Series creates a single-column DataFrame; multiple Series create multi-column DataFrames. |
| Structured Array | NumPy structured arrays where field names correspond to DataFrame column names. |
| Other DataFrame | Create a new DataFrame by copying an existing one. |
| CSV File | Read CSV files via pd.read_csv() and convert to DataFrame. |
| Excel File | Read Excel files via pd.read_excel() and convert to DataFrame. |
| JSON Data | Read JSON data via pd.read_json() and convert to DataFrame. |
| SQL Query Results | Read SQL query results via pd.read_sql() and convert to DataFrame. |
| HTML Table | Extract tables from HTML pages via pd.read_html() and convert to DataFrame. |
| Clipboard Data | Read data from the clipboard via pd.read_clipboard() and convert to DataFrame. |
If the index and columns name attributes are set on a DataFrame, this information is also displayed:
frame3.index.name = "year"
frame3.columns.name = "state"
frame3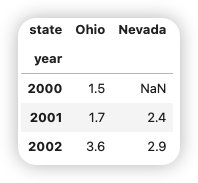
# 二维的ndarray的DataFrame形式返回
frame3.to_numpy()
# 如果DataFrame各列的数据类型不同,则返回数组会选用能兼容所有列的数据类型:
frame2.to_numpy()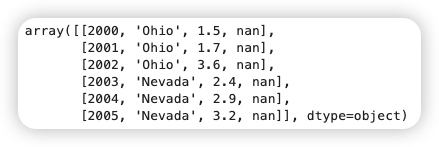
1.2. Merging and Joining DataFrames
In Pandas, concat, join, and merge are the three primary methods for combining and joining DataFrames. Each serves distinct purposes and use cases, as detailed below.
1.2.1. concat: Axis-Based Data Concatenation
concat is primarily used to concatenate multiple DataFrames or Series along a specified axis (rows or columns).
Parameter Description:
- objs: A list of DataFrames or Series to concatenate.
- axis: Concatenation direction;
0for row-wise (default),1for column-wise. - join: Concatenation method;
'outer'(default, keeps all indices) or'inner'(keeps only common indices). - ignore_index: Whether to ignore original indices and generate new ones; default is
False. - keys: Adds hierarchical indexing to the concatenated data.
Example:
import pandas as pd
df1 = pd.DataFrame({'A': [1, 2], 'B': [3, 4]})
df2 = pd.DataFrame({'A': [5, 6], 'B': [7, 8]})
# 按行拼接
result = pd.concat([df1, df2], axis=0)
print(result)
# 按列拼接
result = pd.concat([df1, df2], axis=1)
print(result)Use Cases:
- Simply stacking multiple datasets with similar structures.
- Concatenating by rows or columns without requiring key-based matching.
1.2.2. merge: Key-Based Merging
merge combines two DataFrames based on one or more keys, analogous to SQL JOIN operations.
Parameter Description:
- left: The left DataFrame.
- right: The right DataFrame.
- how: Merge method; options include
'inner'(default, inner join),'left'(left join),'right'(right join),'outer'(outer join). - on: Column name(s) (key) used for merging, must exist in both DataFrames.
- left_on/right_on: Specifies key columns for left and right DataFrames when column names differ.
- suffixes: Suffixes added to overlapping column names to distinguish them.
Example:
df1 = pd.DataFrame({'key': ['A', 'B', 'C'], 'value1': [1, 2, 3]})
df2 = pd.DataFrame({'key': ['B', 'C', 'D'], 'value2': [4, 5, 6]})
# 内连接
result = pd.merge(df1, df2, on='key', how='inner')
print(result)
# 外连接
result = pd.merge(df1, df2, on='key', how='outer')
print(result)Use Cases:
- Associating two tables based on specific columns (keys).
- Handling structured data similar to SQL
JOINoperations.
1.2.3. join: Index-Based Merging
join merges two DataFrames based on their indices, serving as a simplified version of merge.
Parameter Description:
- other: The other DataFrame to join.
- on: Column name or index used for joining.
- how: Join method; options include
'left'(default, left join),'right'(right join),'outer'(outer join),'inner'(inner join). - lsuffix/rsuffix: Suffixes for overlapping column names in left and right DataFrames, respectively.
Example:
df1 = pd.DataFrame({'A': [1, 2], 'B': [3, 4]}, index=['x', 'y'])
df2 = pd.DataFrame({'C': [5, 6], 'D': [7, 8]}, index=['x', 'y'])
# 基于索引的左连接
result = df1.join(df2, how='left')
print(result)Use Cases:
- Simple data merging based on indices.
- Handling data with aligned indices.
| Method | Primary Purpose | Use Case | Flexibility | Performance |
|---|---|---|---|---|
| concat | Axis-based data concatenation | Simple stacking, similar-structured datasets | Concatenate by rows/columns | Suitable for large-scale data |
| merge | Key-based merging, similar to SQL JOIN | Structured data, table association | Supports various join types | Suitable for small-scale data |
| join | Index-based merging | Index-aligned data | Simplified merge | Suitable for simple operations |
1.3. Deleting Rows and Columns
The del keyword can delete columns from a DataFrame, functioning similarly to deleting keys from a dictionary.
frame2["eastern"] = frame2["state"] = "ohio"
print(frame2)
del frame2["eastern"]
print(frame2.columns)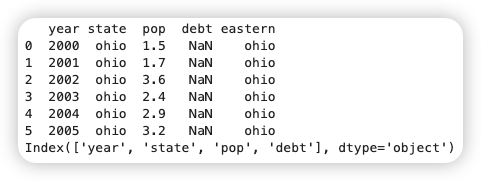
1.1.4. Locating, Reading, and Modifying Data
1.1.4.1. Accessing Columns
DataFrame columns can be accessed as Series using dictionary-style notation or dot attributes.
print(frame2["state"])
print(frame2.year)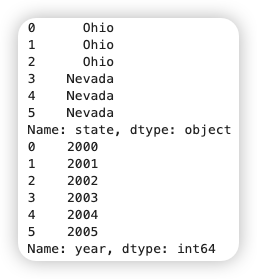
Dot-attribute access is not supported if column names contain symbols other than spaces or underscores.
1.1.4.2. Modifying Columns
import numpy as np
# 通过赋值的方法修改列
frame2["debt"] = 16.5
print(frame2)
frame2["debt"] = np.arange(6.)
print(frame2)
# 将列表和数组赋值给某个列
val = pd.Series([1.2,-1.5,-1.7],index=["two","four","five"]) # 长度必须与DataFrame保持一致
frame2["debt"] = val
print(frame2)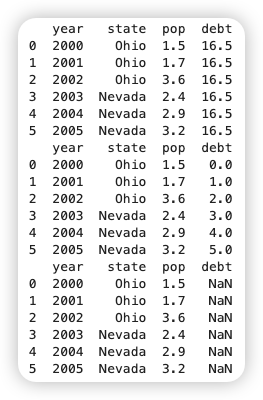
1.1.4.2. Accessing Rows (iloc and loc)
Rows can be accessed by position or name using the iloc and loc attributes.
print(frame2.loc[1])
print(frame2.iloc[2])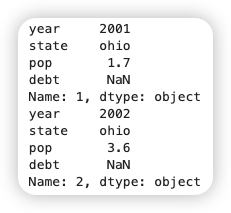
1.1.5. Transposition
Transposition swaps the rows and columns of a DataFrame, converting rows into columns and vice versa. Pandas offers two methods for transposition:
- T Attribute: Directly call
DataFrame.Tfor transposition. - transpose() Method: Use
DataFrame.transpose()for transposition.
import pandas as pd
# 创建一个示例 DataFrame
data = {'Name': ['Tom', 'Jack', 'Steve'], 'Age': [28, 34, 29],
'City': ['London', 'New York', 'Sydney']}
df = pd.DataFrame(data)
# 使用 T 属性转置
transposed_df = df.T
print(transposed_df)
# 使用 transpose() 方法转置
transposed_df = df.transpose()
print(transposed_df)Precautions:
- Transposition changes the DataFrame’s structure but does not modify the original data.
- If the DataFrame contains mixed data types, you may need to adjust data types after transposition.
1.1.6. Resampling (resample)
Resampling converts time-series data from one frequency to another. Pandas provides the resample() method, supporting two types:
- Upsampling: Converting low-frequency data to high-frequency data (e.g., daily to hourly).
- Downsampling: Converting high-frequency data to low-frequency data (e.g., minute to hourly).
import pandas as pd
# 创建一个示例时间序列 DataFrame
data = {'date': pd.date_range(start='1/1/2020', periods=100, freq='D'),
'price': range(100)}
df = pd.DataFrame(data)
df.set_index('date', inplace=True)
# 下采样:将日数据转换为月数据,并计算每月的平均价格
monthly_avg_price = df['price'].resample('M').mean()
print(monthly_avg_price)
# 上采样:将日数据转换为小时数据,并使用前向填充
hourly_price = df['price'].resample('H').ffill()
print(hourly_price)Precautions:
- Resampling requires the DataFrame’s index to be of time type.
- Use
fillna()orinterpolate()methods to handle missing values.