
Look-Ahead Bias: Easy to Understand, Easy to Get Wrong
My earlier note on data labeling got a lot of attention — and some pushback:
You're using the zigzag function. Doesn't that leak future data?
The academic term for "future data" is look-ahead bias. Leaking future information into a backtest is indeed one of the easiest mistakes to make in quant.
This note explains why using zigzag for labeling does not create future data. I'll also walk through other classic examples of look-ahead bias. These are lessons from the trenches that you rarely find in papers.
Zigzag and peak_and_valley_pivots
In that earlier note, I used the zigzag function to find swing highs and lows in candlesticks and used them as labels for supervised learning. Mark peaks as 1, valleys as -1, and everything else as 0, and you get three classes.
The labeled dataset still contains the original OHLC data. So you can build your own features on top of it and train a model to predict tops and bottoms.
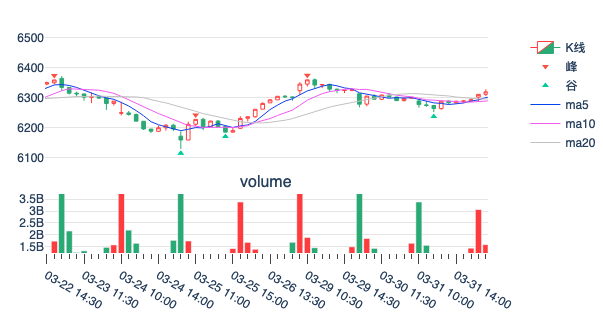
When engineering features (factors), you can use RSI, moving-average turns, upper and lower shadows, volume spikes, round-number support/resistance, trendlines, support and resistance lines, and so on.
The labeling uses the peak_and_valley_pivots function from the zigzag package. You can install it with:
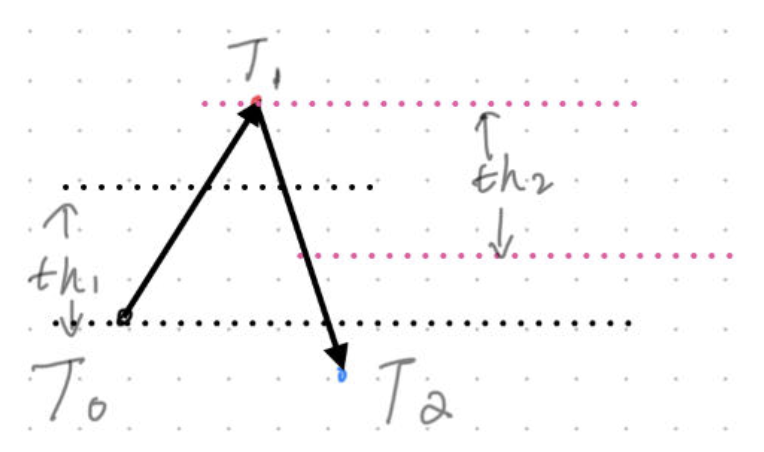
pip install zigzagpeak_valley_pivots takes three arguments: the time series to scan for peaks and valleys, the threshold for a down move, and the threshold for an up move.
In other words, in the sequence $[t_0, t_1, t_2]$, if $th_1$ is the down threshold and $th_2$ is the up threshold, then $t_1$ is marked as a peak when $t_1 >= t_0 \times (1 + th_2)$ and $t_2 <= t_1 \times (1 + th_1)$, as shown below:
Python has many similar libraries. The best known are find_peaks, find_peaks_cwt, and argrelextrema in the scipy.signals module. They all require you to set at least an absolute threshold for what counts as a peak or valley, and some also let you set a window size for stationary points. The nice thing about peak_valley_pivots in the zigzag package is that you set the threshold as a percentage rather than an absolute value — which matches the way we usually think about it.
tip
Digital Signal Processing (DSP) has special uses in quant. **Renaissance** cared a lot about DSP experience when hiring early on, and poached quite a few people from the IBM ViaVoice team. Early speech recognition was a classic DSP application — only later did it all move to deep learning. Techniques like Fourier transforms and wavelet transforms are still the subject of many papers today.First, how do you set the up/down thresholds? In practice, start by computing per-period returns. For stock prices, that's an approximately stationary series. Take its standard deviation, and use ±2 standard deviations as your thresholds.
If returns are approximately normally distributed, then the probability of $t1$ exceeding $t0$ by 2 standard deviations should be under 5%, so it makes sense to treat it as an outlier (note there are a lot of approximations here. Strictly speaking, returns are approximately normal, and the probability of exceeding the mean by 2 standard deviations is under 5%) — in other words, it's exactly the peak (or valley) you're looking for.
The other trick is that you have to understand how peak_valley_pivots handles the head and tail of the data.
Why Do People Say "Zigzag Causes Look-Ahead Bias"?
Either way, peak_valley_pivots always returns a peak (1) or valley (-1) label at index positions 0 and -1, whether or not the move there actually hit the threshold. That is where our discussion of look-ahead bias starts.
Let's look at the labeling chart again. This time I've added numbers to make it easier to discuss.
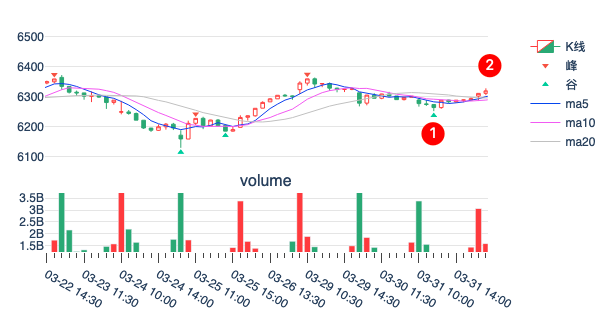
Here, peak_valley_pivots labels position 1 and position 2 as -1 and 1, respectively.
But our labeling tool doesn't show the label at position 2. That's because the label isn't final yet. As we feed in more data, we see the label at position 2 disappear (I'm referring to the return value of peak_valley_pivots, not what's drawn on the chart), until 14:30 on April 6, when peak_valley_pivots labels it again (see position 3).
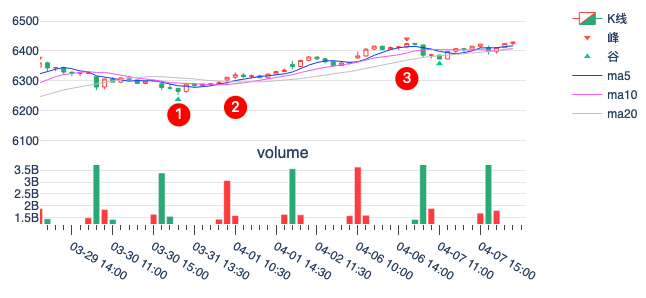
That's what happens when you label historical data. If your labeling tool labels one very long series in a single pass, you'll only hit this problem once, at the head and the tail (⚠️⚠️ but note: the threshold is then computed over the full life of that series, which won't match a threshold computed over a shorter, more recent window).
When you label in batches, the data gets truncated, which creates many more heads and tails. At those boundaries, peak_valley_pivots still spits out labels, but they are often unstable — at the start of a batch, they're very likely wrong or spurious. From the second-to-last label backward, though, the labels are locked in and won't change.
Does that introduce future data?
Of course not. The labeling process is perfectly valid.
⚠️But some people don't use zigzag for data labeling — they use it to run a backtest. That's where things break.⚠️
Here's exactly how that backtest error happens: at time $t_2$ you detect a peak that occurred at time $t_1$, and then you sell at the $t_1$ price:
- If your backtest engine is correct, that simulated trade can never fill. If it does fill, it means price has turned back up, and a valley has already formed between $t1$ and now ($t_0$). In other words, you just wrongly sold a stock you should have held.
- Some people write their own backtest engine — a vectorized backtest over a pandas DataFrame, for example — where it's very easy to introduce this bug, so that at time $t_0$ you go back to time $t_1$ and sell at the high tick.
It's easy to understand, but it can hide deep in your code — if you don't understand how a backtest engine actually works.
tip
If zigzag top/bottom labels can't be used for prediction, are they still useful? Absolutely. We can't use zigzag to predict tops and bottoms, but we can use it to label history and check whether the top/bottom features we've found are actually high-probability signals.If they are, then in live trading, when those features show up again, we have the confidence to call a top or a bottom.
Look-ahead bias shows up in many places. Generally, it creeps in during data collection and release, or during data processing.
Financial data is a classic source. Financials are often "indexed" by quarter. Naturally, they are compiled and published well after that index date.
Take U.S. macro data for Q1 2019 as an example. The advance GDP estimate came out on April 25, 2019; the first revision on May 30; the final revision on June 27. That's normal and expected.
tip
How do you avoid this kind of look-ahead bias in backtest and live trading? We cover it in detail in Lesson 22 of our *24 Quant Lessons* course.If you run a backtest now (in 2024), the data has already been restated. When the backtest reaches March 2017, you'll see -55.43 million, which helps you dodge the bullet in simulation. But in live trading in May 2017, the reported prior-year profit was 75.71 million. Your model could not have dodged it live.
Other classic sources of look-ahead bias include:
- Forward-adjusted prices
- Misaligned references
- Price peeking
- Lookback statistics like max, min, and rank — including zigzag-like functions
Beyond look-ahead bias, backtests can also suffer from survivorship bias, overfitting, market impact, capacity constraints, too short a history, and incorrect trading rules. You only learn these from live fire. We cover them all in our 24 Quant Lessons course, which can take you from quant beginner to quant pro fast.
You can also keep following this account — we'll have a chance to dig deeper into these concepts going forward.
Cover Story
The cover shows the Charles B. Wang Center at Stony Brook University, donated by Chinese-American billionaire Charles Wang, founder of CA Technologies. It's a building dedicated to understanding the interaction between Asian cultures and the rest of the world.
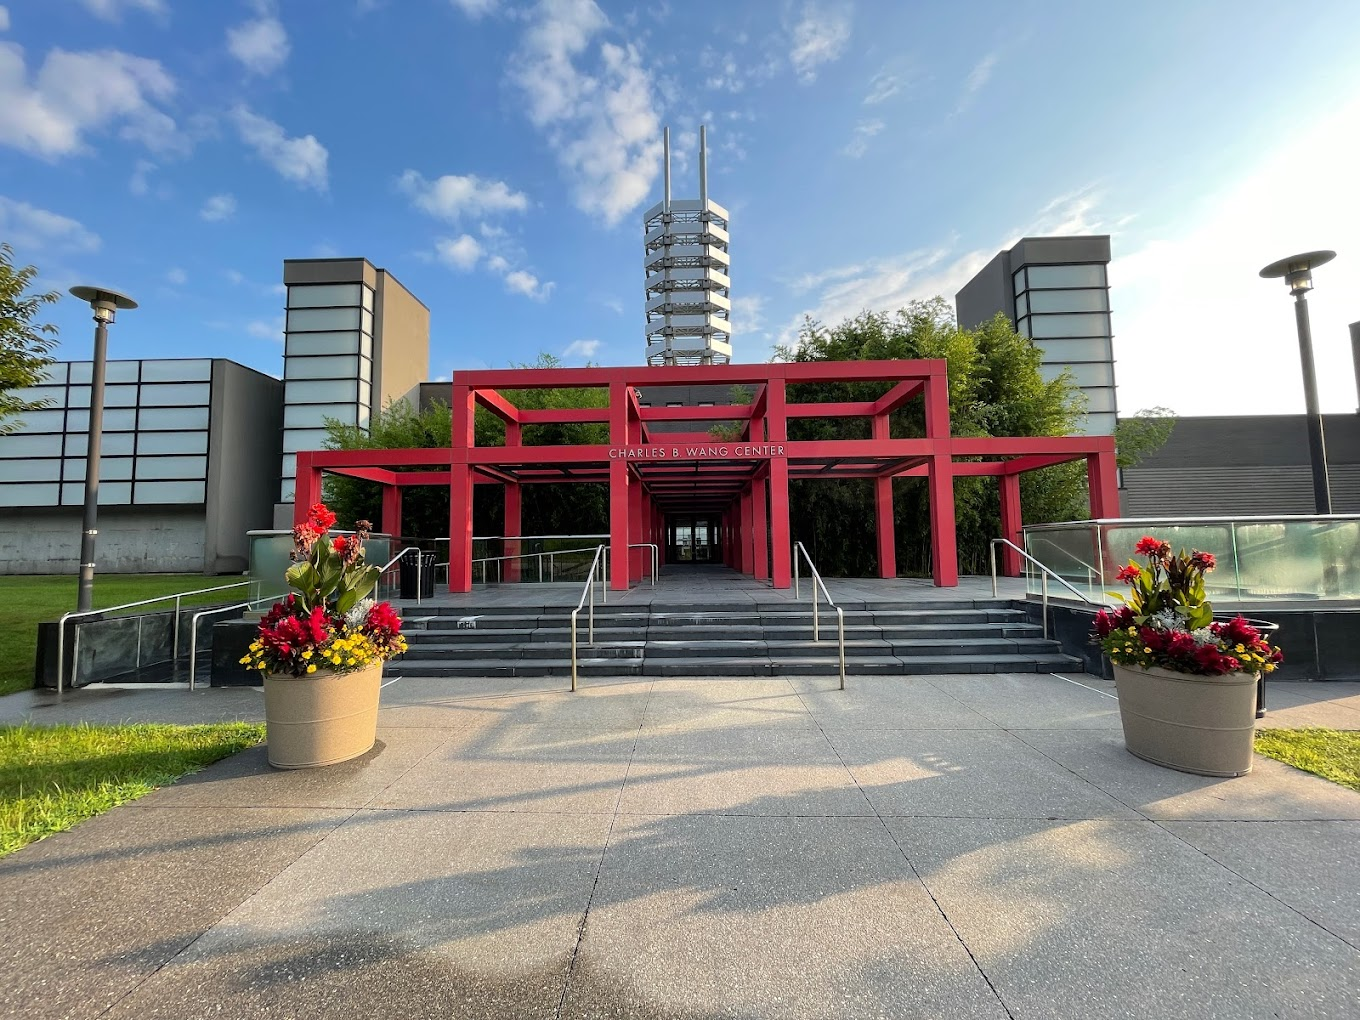
Built from brick and translucent white glass, it evokes the paper-covered lattice windows of traditional Chinese architecture, with a stepped arch bridge reminiscent of Chinese temples. Inside there's an East Asian food court for students — a window into East Asian, and especially Chinese, food culture.
Stony Brook has deep ties to the Chinese community. C.N. Yang taught here for 37 years. Shing-Tung Yau served as a teaching assistant here. Shiing-Shen Chern was an honorary doctorate.
Stony Brook has produced many luminaries, with at least 8 Nobel Prizes to its name. Quant legend James Simons once chaired its math department.