
PCA, DWT, and XGBoost: A Machine Learning Trading Strategy
This is a paper published by Nobre and Neves in 2019. It generates a machine learning-based trading strategy that achieves better returns than a Buy-and-Hold strategy and another benchmark. The main text of this article is the abstract of the original paper; in the QuanTide commentary at the end, I provide some comments.
The article introduces an expert system applied to finance, integrating Principal Component Analysis (PCA), Discrete Wavelet Transform (DWT), Extreme Gradient Boosting (XGBoost), and Multi-Objective Optimization Genetic Algorithms (MOO-GA). The system aims to provide optimal buy/sell signals for investors, seeking higher returns at lower risk levels.
PCA is used to reduce the dimensionality of the financial input dataset, while DWT denoises each feature. The processed dataset is then fed into an XGBoost binary classifier, with hyperparameters optimized by MOO-GA.
Results show that PCA significantly enhances system performance. Applying PCA jointly with DWT allows the system to outperform traditional Buy-and-Hold strategies in three out of five financial markets, achieving an average portfolio return of 49.26%, compared to 32.41% for the Buy-and-Hold strategy.
Related Work
Principal Component Analysis
In related work, Principal Component Analysis (PCA) is used to reduce the dimensionality of high-dimensional datasets while preserving key data features. PCA forms a new set of principal components through linear combinations of the original dataset, maximizing retained information and exhibiting high variance. By removing dimensions with minimal variation, PCA simplifies the dataset and improves computational efficiency.
Discrete Wavelet Transform
Discrete Wavelet Transform (DWT) is a powerful tool for handling the time-varying characteristics of time-series data in real-world problems. Unlike traditional Fourier transforms, it is particularly suitable for non-stationary signals, such as stock market prices.
Traditional Fourier transforms assume signals are periodic and defined over the entire time interval, whereas wavelet transforms allow signals to be represented as superpositions of time-localized basis functions. This enables wavelet transforms to capture both time and frequency information of signals simultaneously.
The foundation of wavelet transform is representing any function as a superposition of wavelets that constitute the wavelet basis. These wavelets are scaled and translated copies of finite-length oscillating waveforms (called mother wavelets), i.e., sub-wavelets. Selecting the optimal wavelet basis depends on the characteristics of the original signal to be analyzed and the expected analytical purpose. The final result is a set of time-frequency representations with different resolutions, which is why wavelet transforms are called multi-resolution analysis.
In the method proposed in this paper, only Discrete Wavelet Transform (DWT) is used. DWT decomposes signals into a set of orthogonal wavelets. Compared to continuous wavelet transforms, DWT is more suitable for practical applications because it facilitates discrete processing on digital computers.
The application of wavelet transforms in financial time-series data preprocessing is primarily for denoising, thereby helping to improve the prediction accuracy of subsequent models.
Genetic Algorithms
Genetic Algorithms (GA) are meta-heuristic optimization methods inspired by the biological evolution process in nature, used to solve optimization problems in complex spaces. They find approximate optimal solutions by simulating natural selection and genetic mechanisms.
Genetic algorithms start with an initial population of randomly generated individuals, representing candidate solutions to the problem. Each individual, or chromosome, contains a series of parameters or variables known as genes.
In each generation, individuals are selected for reproduction based on their fitness (i.e., performance scores in the given optimization task). Individuals with higher fitness are more likely to be selected and produce new offspring through crossover operations (exchanging gene segments between pairs).
Additionally, random genetic mutation operations are performed on some offspring to introduce new genetic information.
These operations are repeated over multiple generations until predefined stopping criteria are met, such as reaching the maximum number of iterations or the population converging to a stable state. The ultimate goal is to obtain sufficiently good solutions after a series of evolutionary processes.
XGBoost
XGBoost (Extreme Gradient Boosting) is an optimized distributed gradient boosting library designed for efficiency, flexibility, and portability. It improves upon traditional gradient boosting decision trees by adding performance-enhancing features. Specifically, XGBoost introduces regularization terms to simplify models, helping reduce the likelihood of overfitting, and supports parallel processing, significantly accelerating training speed.
An important feature of XGBoost is its allowance for custom loss functions and automatic handling of missing data. It improves computational efficiency by constructing multiple trees in parallel, unlike traditional gradient boosting models that typically build trees sequentially. Furthermore, XGBoost allows customization of objective functions and evaluation metrics, making it highly suitable for various machine learning tasks, including predicting stock price directions in financial markets.
Research indicates that when applied to predicting stock market price directions, XGBoost as a classifier outperforms non-ensemble methods such as Support Vector Machines (SVM) and Artificial Neural Networks (ANN). Particularly in 60-day and 90-day prediction horizons, XGBoost demonstrates better long-term prediction accuracy.
Proposed Solution
System Architecture
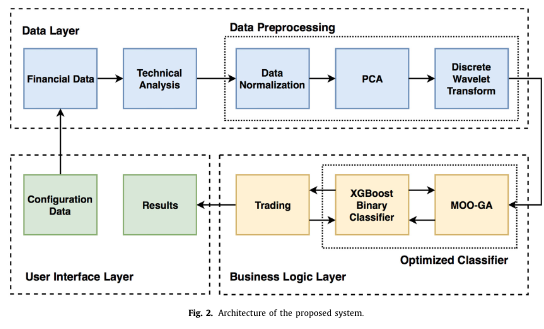
Objective Equation
In this paper, the objective is to predict whether the closing price on day $t+1$ (Close_{t+1}) will have a positive or negative change relative to the closing price on day $t$ (Close_t). Therefore, a supervised learning solution, specifically a binary classifier, is proposed. The target variable y to be predicted is the signal of the closing price change on day $t+1$ relative to day $t$, following a binomial probability distribution y ∈ {0, 1}, where:
- If the closing price change is positive,
ytakes the value1; - If the closing price change is negative,
ytakes the value0.
This objective can be mathematically defined as follows:
[ y_t = \begin{cases} 1 & \text{if } Close_{t+1} - Close_t \geq 0 \ 0 & \text{if } Close_{t+1} - Close_t < 0 \end{cases} ]
Where:
Close_{t+1}is the closing price on day $t+1$.Close_tis the closing price on day $t$.
The array of all target variables is named Y. The financial input dataset X is the dataset output from the data preprocessing module, where PCA and DWT techniques are applied to the normalized dataset, which contains original financial data and technical indicators.
Technical Analysis Module
The technical analysis module receives outputs from the Financial Data Module and applies multiple technical indicators to them. The primary purpose of using technical indicators is that each provides basic information about past raw data in different ways; therefore, combining different technical indicators helps detect patterns in financial data, thereby improving the performance prediction system for financial data.
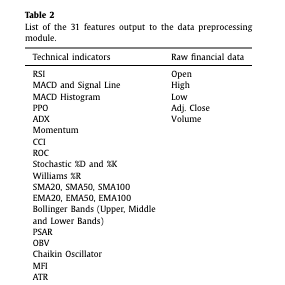
This module creates a dataset that will serve as input for the data preprocessing module. The dataset consists of combinations between the 26 used technical indicator sets and 5 original financial data features, producing a dataset with 31 features as shown in the table below. Technical indicator calculations are performed using the Python library TA-Lib.
Data Preprocessing Module
Data Standardization
Omitted.
Principal Component Analysis
The PCA module receives the normalized input dataset, containing 26 technical indicators and 5 original financial data features, totaling 31 normalized features. To reduce the risk of overfitting and lower the system's computational cost, the PCA module transforms the dataset with 31 features into a lower-dimensional dataset while retaining most of the original dataset's variance.
PCA first fits its model to the normalized training set to determine components representing directions of maximum variance. Then, principal components are sorted by the amount of variance they explain, and only those summing to at least 95% of the original training set variance are retained. Finally, data is projected onto the principal components, resulting in a lower-dimensional dataset because it retains only data samples that better explain relationships between features. The reduced dataset is then fed into the wavelet module.
The PCA module uses the Scikit-learn Python library.
Wavelet Transform
Although the dataset has been simplified in the PCA module, reducing dimensionality and retaining only data that better explains relationships between features, some irrelevant data samples may still produce negative impacts on system training and prediction performance.
PCA technology removes irrelevant data points from subsets of features, while DWT technology performs denoising in the time domain for each feature present in the PCA-reduced dataset. This process reduces the impact of noise in the dataset while preserving the essential components of each feature as much as possible.
The wavelet bases tested for each financial market in this system include: Haar wavelets, Daubechies wavelets, and Symlet wavelets. For Daubechies and Symlet wavelets, tested orders are 3, 6, 9, 15, and 20.
Although higher decomposition levels can eliminate more noise, thereby better representing the trend of each feature, this may also eliminate fluctuations containing market characteristics. Therefore, in this system, tested decomposition levels are 2, 5, and 7 to find the optimal denoising decomposition level for each financial market.
DWT first specifies the wavelet basis, order, and decomposition level used. Then, for each feature in the training set, DWT performs multi-level decomposition, producing one approximation coefficient and $j$ detail coefficients, where $j$ is the selected decomposition level.
To calculate approximation and detail coefficients for the validation and test sets, one data point is added to the training set at a time, coefficients for the new signal are calculated, and coefficients corresponding to the added data point are saved to avoid considering future information. This process is executed until all points in the validation and test sets have their respective coefficients calculated. Then, the obtained detail coefficients are thresholded and the signal is reconstructed, producing a denoised version of each original dataset feature. After applying DWT, the dataset is fed into the XGBoost module.
The PyWavelets and scikit-image libraries are used to develop the DWT module in this system.
XGBoost Module
The XGBoost binary classifier is responsible for the system's classification process.
Binary Classifier
The classifier's output $\hat{y}$ is the predicted value given the current observation $x$, corresponding to the actual date $t$. The variable $\hat{y}$ ranges within $[0,1]$, and the collection of all $\hat{y}$ corresponds to predicted trading signals, indicating whether the system should hold long or short positions in the next trading day.
Before the XGBoost binary classifier algorithm begins, a set of parameters must be selected. Parameters defining the machine learning system architecture are called hyperparameters. Since each time series has its own characteristics, there is a different set of optimal hyperparameters for each analyzed time series, even if the model has good generalization capabilities, i.e., hyperparameters yielding good results on out-of-sample data. Therefore, to achieve the best results in each analyzed financial market, the optimal set of hyperparameters must be found. For this, the MOO-GA method is used, as described in the next section.
Preprocessed data output from the data preprocessing module is fed into the XGBoost binary classifier, along with the target variable array $Y$ to be predicted, and both are divided into training, validation, and test sets. After defining the dataset and XGBoost hyperparameters, the training phase begins. The system's generalization capability is measured by its performance on unseen data. Therefore, after the training phase ends, an out-of-sample validation set is used to test the model obtained during training to verify the generalization capability of the obtained model.
This validation set is used in the MOO process, helping to select the best-performing solution using unseen data. After the training and validation phases end, the final model is created, i.e., the model trained with the best hyperparameter set found by MOO-GA, and its generated output is compared with the test set to verify prediction quality. As mentioned earlier, the output takes the form of probabilities that a data point belongs to class 0 or 1.
The XGBoost library is used to develop the XGBoost binary classifier in this system.
Multi-Objective Optimization Genetic Algorithm
When building machine learning models, there are many design choices for model architecture. Most of the time, users do not know beforehand what the architecture of a given model should look like, so exploring a range of possibilities is desirable.
This is the case for the hyperparameters of the XGBoost binary classifier, which define the classifier's architecture. This process of finding the ideal model architecture is called hyperparameter optimization.
A multi-objective optimization method is adopted instead of single-objective optimization because our ultimate goal is to achieve a trading system with high returns and low risk. Therefore, it is natural to use statistical metrics to evaluate the system's performance relative to the predictions made -- in this case, Accuracy; but on the other hand, metrics are also needed to evaluate the system's ability to achieve good returns while minimizing losses -- in this case, the Sharpe Ratio.
Thus, candidate solutions are evaluated based on two selected objective functions: Accuracy and Sharpe Ratio. The collection of each solution represents the fitness function to be optimized by MOO-GA, with the goal of maximizing each objective function. Therefore, given the XGBoost binary classifier, financial dataset $X$, and target variable array $Y$, MOO-GA searches for and optimizes the XGBoost binary classifier hyperparameter set, aiming to maximize the accuracy and Sharpe ratio of the obtained predictions.
To find the best hyperparameter set aimed at maximizing the two previously mentioned objective functions, the MOO-GA method is based on the Non-dominated Sorting Genetic Algorithm-II (NSGA-II).
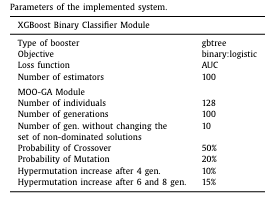
Due to the numerous hyperparameters in the XGBoost binary classifier, only those having a significant impact on the binary classifier's architecture and thus its overall performance are optimized. The hyperparameters selected for optimization also have a significant impact on the bias-variance tradeoff: learning rate, maximum tree depth, minimum child weight, and subsample. Each of these hyperparameters constitutes a gene in the chromosome of MOO-GA.
In the proposed MOO-GA, a two-point crossover operator is used, where two points are selected on the parent string, and everything between the two selected points is exchanged between parents. The selected mutation rate is 0.2, meaning that each new candidate solution generated by the crossover operator has a 20% probability of undergoing mutation.
We also use hypermutation, a method to reintroduce diversity into the population in evolutionary algorithms. In this system, the mutation rate is adjusted during the evolutionary process to help the algorithm escape local optima.
The following figure shows the important hyperparameters:
The DEAP Python library is used to develop the MOO-GA module in this system.
Trading Module
The trading module is responsible for simulating real financial market trading. Its main functions include:
- Receiving inputs: Obtaining trading signals and financial data from the XGBoost module.
- Simulating market orders: Simulating market orders in the financial market based on input trading signals.
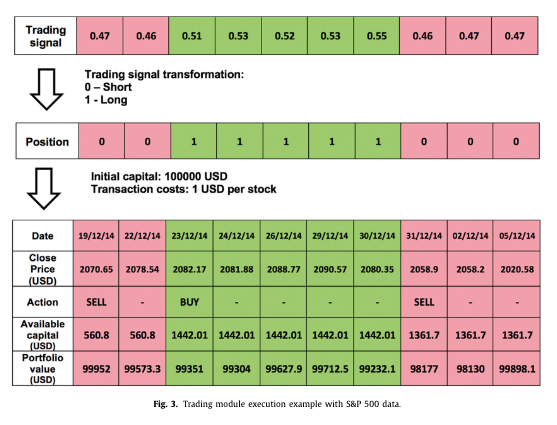
- State machine design: Employing a state machine with three states -- long, short, and hold -- to execute trades. Specifically, given a trading signal, the state machine executes corresponding actions based on market orders in the signal. The prediction result $\hat{y}$ of the XGBoost binary classifier represents the predicted probability $p(\hat{y})$ of class $p$. Since the two selected classes represent changes in closing prices on day $t+1$ relative to day $t$, these predictions can be used to construct trading signals.
The trading signal construction method is as follows:
- If $p(\hat{y}) \geq 0.5$, and the selected class is 1, it means the stock's closing price (close) on day $t+1$ is expected to show a positive change, representing a buying opportunity on day $t$, i.e., a long position is taken. This action is represented by position 1 in the corresponding date of the training signal;
- Conversely, if $p(\hat{y}) < 0.5$, and the selected class is 0, it means the stock's closing price (close) on day $t+1$ is expected to show a negative change, representing a selling opportunity on day $t$, i.e., a short position is taken. This action is represented by position 0 in the corresponding date of the training signal.
Therefore, the value of the trading signal ranges within $[0,1]$, and the trading module is responsible for interpreting these values and converting them into trading actions.
Experimental Results
The following figure shows a schematic of the training process.
Case 1: Effect of Using PCA
In the first case study, the impact of PCA technology on the performance of the implemented system is analyzed.
The benchmark system is divided into two configurations:
Basic System: The input dataset contains 31 normalized financial features. Improved System: The input dataset is standardized. In the improved system, PCA (Principal Component Analysis) technology is applied to reduce the dimensionality of the dataset. Specifically, after applying PCA to the standardized dataset containing 31 financial features, 6 principal components are retained for each financial market. This means the original 31 financial features are reduced to 6 low-dimensional features.
The following figure lists the experimental results for each system as well as the Buy-and-Hold strategy. The best results obtained for each financial market are highlighted in bold.
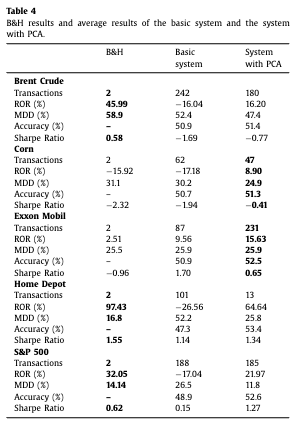
By examining the obtained results, it can be concluded that the use of PCA technology plays an important role in improving system performance, as it not only achieves higher returns but also higher accuracy values.
PCA dimensionality reduction allows the XGBoost binary classifier to generate models with lower complexity and good generalization capabilities, thereby avoiding overfitting to training data. This allows the system to achieve higher returns than the Buy & Hold strategy on corn futures contracts and ExxonMobil stock.
In the other three sub-markets, using dimensionality reduction technology is crucial for the system to achieve positive returns, because in the basic system, generalization capability is insufficient to correctly classify the test set. Without applying PCA, the system could only achieve higher returns than the Buy-and-Hold strategy on ExxonMobil company stock.
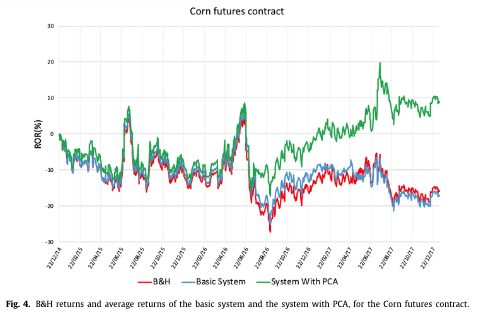
Figure 4 shows a comparison chart of returns obtained using the basic system and the system with PCA during testing. It can be seen that, as mentioned earlier, introducing PCA allows the system to achieve higher returns.
Case 2: Effect of Using Discrete Wavelet Analysis
In this case, we study combining DWT technology with PCA to simultaneously achieve dimensionality reduction and denoising of input data, to see if applying these two technologies together yields better results.
The following figure lists the results for each system and the Buy-and-Hold strategy. The best results obtained for each financial market are highlighted in bold. Due to the complexity of analyzing all combinations, only the two best combinations are shown in the figure.
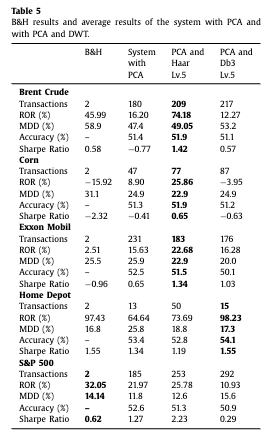
By examining the obtained results, it can be concluded that the combination of PCA and DWT denoising technologies enables the system to achieve better results than systems using only PCA.
This is because in this system, PCA reduces the dimensionality of the financial input dataset, and DWT denoises this reduced dataset, which not only helps avoid overfitting training data but also helps remove some irrelevant samples that might harm system performance, thereby assisting the system's learning process and improving its generalization capability.
However, this performance improvement is only verified when using appropriate wavelet bases, orders, and decomposition levels, because using DWT incorrectly compared to using only PCA leads to worse system performance and even lower returns.
Case 3: Performance Evaluation
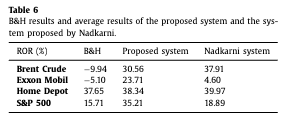
In this case study, the performance of the proposed system is compared with a strategy extracted by Nadkarni, Neves in 2018 to verify the pros and cons of using the proposed method compared to other methods.
The following figure shows the performance comparison of the two systems.
Conclusion
This paper proposes a system combining PCA and DWT for dimensionality reduction and denoising respectively, and an XGBoost binary classifier optimized by MOO-GA, aiming to implement a trading strategy with maximum possible returns while minimizing risk levels. Experimental results support the effectiveness of this approach.
QuanTide Commentary
This paper presents a complete framework for building trading strategies based on machine learning and creatively uses advanced algorithms like DWT and GA. This trading system uses time-series features as training features, providing good coverage for stocks, futures, and cryptocurrencies. Note that it is not an asset pricing strategy.
There are several points in the paper worth discussing, which are also difficulties in building machine learning trading strategies.
Data Labeling Issues
The paper implements a supervised learning algorithm, making data labeling indispensable. The labeling method used in the paper is:
For data at period $t$, if pnl > 0, label as 1, otherwise 0.
The problem here is that if a stock's PnL absolute value is below 0.5%, it actually does not have strong labeling significance -- in other words, this result does not necessarily reflect the main force's operational intent; it is likely just a state where the stock price fluctuates normally with the market after the main force's absence. In this case, whether classified as 1 or 0, it could be wrong. To offset the negative impact of such erroneous labeling, we often need to produce more correct labels.
Genetic Algorithms
When searching for model hyperparameters, the paper uses genetic algorithms. Using genetic algorithms is not mandatory; it is merely an algorithm for quickly finding hyperparameters. We could also use GridSearch or RandomSearch methods.
We note that the paper does not provide a comparison between using MOO-GA and not using MOO-GA, unlike the comparisons for PCA and DWT. This also validates our viewpoint.
Using DWT to Remove Noise
There are two points in this section worth discussing. One is the stage at which the paper applies DWT. It is placed after TA. If you are familiar with technical analysis (TA), you know that after raw market data is processed by TA into technical indicators, it has already extracted time-series features from the raw data, and these technical indicator sequences may not necessarily be wave signals. So, what is the significance of using DWT for filtering at this stage? It is difficult to explain.
The paper also mentions that using DWT does not always yield good results; the reason may lie here.
Besides the stage of using DWT, the utility of using DWT is also worth discussing. Most papers use DWT for filtering -- in this regard, no matter how good the data they provide is, I always believe it cannot compare to SMA -- SMA has clear financial meaning, while other methods only possess mathematical sophistication.
However, if you believe DWT can remove noise -- then an obvious inference is that it knows which parts are signals and which are noise. In that case, why don't we use wavelet analysis to extract signal features for learning?
Therefore, a better solution would be to treat DWT as a module parallel to the TA module, used to generate features.
Regarding Normalization Algorithms
The paper mentions they used Min-Max for normalization. This is a disastrous choice. We can only apply Min-Max normalization to data with a fixed range, while theoretically, the value domain of stock prices is $(0, +\infty)$.
In our study of quantitative finance, referring to published papers is undoubtedly a shortcut to growth. However, some scholars lack substantial practical trading experience, leading to various flaws in papers, which undoubtedly also leads to paper results being unusable in live trading. Therefore, we have opened the course "Factor Investing and Machine Learning Strategies." If you are interested in this field but find no entry point, you can join us to learn together.
The paper can be downloaded here