
Why RSI Top Divergence Happens: A Multi-Timeframe Hypothesis
You've probably seen the "Di Bei Li" meme going around lately. As a serious quant channel, we're not here for the gossip. But it did pull my attention back to a topic I've long cared about: top and bottom divergence in technical indicators — what causes it, and can we predict it?
That meme dragged my focus back to this area, and suddenly I had a hypothesis. I haven't fully proven it yet, but it's worth following my channel for.
The hypothesis is: daily RSI top divergence happens because weekly RSI still has room to run. When weekly RSI also reaches its prior high, it triggers a pullback. At that point, even though daily price makes a new high, overhead supply is unstable, pullbacks multiply, and RSI falls.
What Is Divergence?
Investopedia defines divergence for technical indicators as:
quote
Divergence is when the price of an asset is moving in the opposite direction of a technical indicator, such as an oscillator, or is moving contrary to other data. Divergence warns that the current price trend may be weakening, and in some cases may lead to the price changing direction.There is positive divergence and negative divergence. Positive divergence indicates a move higher in the asset's price is possible. Negative divergence signals that a move lower in the asset is possible.
The right panel below shows a daily top divergence. The left panel shows the corresponding weekly picture.
The sub-chart uses RSI, an excellent oscillator that captures the money-making effect and the balance of bull vs. bear strength.
In the chart, every swing high and low is labeled automatically by our program. The labels use our own adaptive-parameter algorithm, which works well across most periods and timeframes. This time, however, it failed to flag the high of the week of March 22 on the weekly chart.
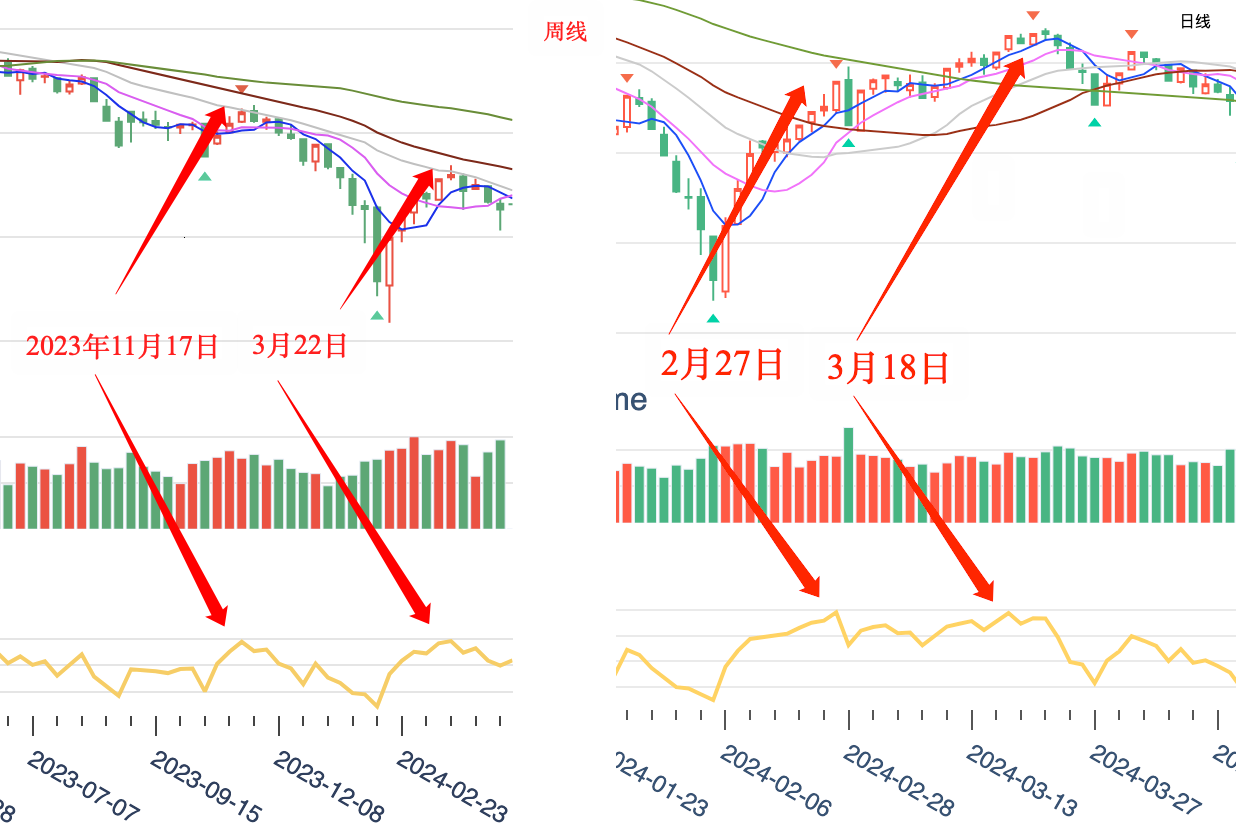
On the right (daily) chart, note the two peaks on February 27 and March 18. The second peak is higher in price, but slightly lower in RSI (prior high 78.3, later high 77.7) — a classic top divergence.
In our course we introduced an original but more accurate framework for RSI: it's not that below 30 it must bounce and above 70 it must pull back. Instead, compare it with RSI at the previous peak (or trough). On a rally, if RSI exceeds its prior-peak reading, a pullback becomes likely.
But that framework has its own problem: first, in the chart, daily RSI had already broken above the prior high from the January 25, 2024 down-channel, yet the pullback didn't come until February 27. We've already solved that issue in the course.
Second, why did price keep rising after February 27 until a top divergence appeared on March 18? I never had a good answer to that top-divergence puzzle, though I wrote several detection routines for it myself.
Hypothesis and Validation
Here is a hypothesis to answer the second question: even though daily RSI was already at a high on February 27, weekly RSI was still low — it was not objecting to and blocking further upside. After a brief daily consolidation, driven by other factors, price kept rising until the week of March 22, when an intraday break above the prior high of 60.5 triggered a large weekly-level pullback.
tip
From March 21 to March 27, the CSI 1000 pulled back more than 6.94% in a row, setting up a rebound — that's another story and another opportunity. As we showed in an earlier post, statistics put the rebound probability after the close on March 27 at over 91.4%. In that situation, you should **buy the dip** decisively.Let's verify with data:
# 日线2月27日、3月18日顶背离,前者RSI 78.3,后者RSI 77.7
dclose = dbars["close"].astype(np.float64)
drsi = ta.RSI(dclose, 6)
for dt in (datetime.date(2024, 2, 27),
datetime.date(2024, 3, 18)):
mask = dbars["frame"] == np.datetime64(dt)
i = np.flatnonzero(mask)[0]
print(dt, dclose[i], drsi[i])
# --- output ---
# 2024-02-27 5394.03 78.3
# 2024-03-18 5648.01 77.7As the data show, daily price was rising while RSI was falling — a daily top divergence.
Now look at the weekly:
# 周线rsi前高出现于2023年11月17日,数值为60.5
wclose = wbars["close"].astype(np.float64).copy()
nov_17 = np.datetime64(datetime.date(2023,11, 17))
i = np.flatnonzero(wbars["frame"] == nov_17)[0]
rsi = np.round(ta.RSI(wclose, 6), 1)
rsi[i]The prior high was 60.5. Here's a trick — leave me a comment if you don't follow it:
# 3月22日,周线rsi数值盘中突破 61.9,高于前高60.5,触发回调
mar_22 = np.datetime64(datetime.date(2024, 3, 22))
i = np.flatnonzero(wbars["frame"] == mar_22)[0]
wclose[i] = wbars["high"][i]
rsi = ta.RSI(wclose.astype(np.float64), 6)
rsi[i]The later reading is 61.9, so it triggered a pullback, and that resistance was confirmed.
tip
Note that RSI pulled back well before reaching 70. So every RSI textbook you've seen needs a rewrite. There is no one size fits all. Different symbols, timeframes, and market regimes need different parameters. Those parameters should be computed adaptively with quantitative code (or machine learning).For high-frequency quants, it's tick-level data — they may hold for minutes before rebalancing; retail and most quant strategies operate on daily and weekly frequencies, holding for days before rebalancing; long-term capital works on a quarterly basis. The longer the horizon, the larger the capital, and the stronger its impact on direction when it rebalances.
By now you've probably guessed: some capital exits at daily RSI highs; much more capital exits at weekly RSI highs; and even more capital exits at monthly RSI highs.
But I suspect no capital exits on quarterly RSI highs. Many truths cannot be linearly extrapolated.
The reason I say this is that quarterly money trades on fundamentals, not technicals. Some people mix fundamental factors and technical factors together, whether in a multi-factor regression or in machine learning — that's wrong. They just fight and cancel each other out.
So from now on, set an alarm for your stocks: compute the prior RSI highs on the daily, weekly, and monthly charts, then monitor them in real time.
Once all three reach their highs, the rally is over. If the monthly reaches a high while daily and weekly are no longer at highs but have printed top divergence, you must have seen stagnation at the top (volume piling up without much upside) — by then much of the smart money's inventory has already changed hands.
It's very dangerous not to leave at that point. The pullback that follows could last for months. Lao Hu says, "If I don't cut, how can you cut me?" But Hu Xijin won't live to see that day.