
ESG Factor Investing: Data Sourcing & Quant Implementation
Global capital is voting with its feet!
From fossil fuels to financial markets, the green transition is irreversible. By 2024, 151 countries had announced carbon neutrality targets, 120 had enshrined them in law, and 86 had provided clear roadmaps. Capital is signaling its stance through valuations and fund flows: sustainability is the new consensus. In the capital’s pursuit of “sustainable value,” **ESG** (Environmental, Social, and Governance) has emerged as the core metric for measuring the sustainable competitiveness of both enterprises and economies.E | Environmental: Carbon emissions, energy and water resource efficiency, pollution and abatement pathways, and supply chain environmental risks.
S | Social: Employee health and safety, labor rights and diversity/inclusion, product safety and data privacy, community impact, and social contributions.
G | Governance: Equity and board structure, internal controls and compliance, anti-corruption and related-party transaction disclosures, and executive compensation aligned with incentives.
While rating agencies use different methodologies, the essence remains the same: assessing which entities possess the ability to continuously generate free cash flow and exhibit risk resilience in the “survival of the fittest” dynamics of the green era.
So, what characterizes companies with high ESG scores?
E, Environmental Metrics Are Robust:
- Possess Science-Based Targets (SBTi) and mid-to-long-term abatement roadmaps (covering Scope 1, 2, and 3), with disclosed progress.
- Capital expenditure increasingly favors green technologies and energy-efficiency upgrades, while energy and water intensity per unit of output continuously decline.
- Supply chains implement environmental entry and audit mechanisms, with near-zero major environmental incidents and established emergency plans.
S, Positive Social Contribution:
Workplace injury/turnover/absenteeism rates are below industry averages, with quantifiable improvements in employee satisfaction and training hours.
Zero major penalties for product compliance and data privacy incidents, supported by third-party security assessments.
Measurable contributions to vulnerable groups and communities, positively correlated with core business, rather than one-off donation stunts.
G, Standardized Corporate Governance:
Board independence and diversity meet standards, with effective audit and risk-control committees; meeting minutes and conclusions are traceable.
Executive compensation is linked to long-term performance/sustainability metrics (e.g., ROIC, carbon intensity, product quality), reducing short-term profit-chasing.
Disclosure is complete, timely, and comparable, with transparent major related-party transactions and anti-corruption mechanisms, and effective whistleblower channels.
Why Is ESG Important?
These characteristics are not accidental; they are the result of long-term accumulation by high-quality enterprises. ESG is not just a reflection of responsibility but also an externalization of corporate resilience and sustainable capability.Homogeneous strategies in an informationally competitive environment only dilute each other. To squeeze out incremental excess returns at the margin, we must look for sources where “information is not yet fully priced in.”
ESG is currently a blue ocean in alternative data, especially higher-frequency ESG news and event data, which have been empirically shown in the domestic market to offer considerable excess return potential and better risk exposure structures. Furthermore, excluding negative events can significantly improve the information ratio.
Adding ESG to the signal pool is not about attaching a moral label; it is about introducing “heterogeneous information sources” to reduce crowding, improve left-tail risk, and enhance portfolio robustness across different market conditions.
Selecting Sources Before Downloading: How to Choose ESG Data
To avoid “garbage in, garbage out,” we must ensure our data is tradeable in nature:
- Frequency and Timeliness: Does the update frequency reach quarterly or shorter intervals for event pushes?
- Coverage and Density: Breadth of target coverage, length of historical data, and continuity.
- Traceability and Consistency: Rating methodologies and dimension weights.
- Data Quality: Missing rates, outliers, etc.
Next, we will demonstrate the data download process.
2. Downloading Data
We use Akshare for data downloads, as the Tushare platform currently does not provide ESG data.
2.1. Sina Finance ESG Data
By running the following code, we can retrieve all ESG data available on Sina Finance:
import akshare as ak
import pandas as pd
#新浪数据下载
stock_esg_rate_sina_df = ak.stock_esg_rate_sina()sina = data_home / "sina_esg_data.xlsx"
# 保存为Excel文件
stock_esg_rate_sina_df.to_excel(sina, index=False)
# 输出保存成功的消息
print(f"File saved at: {sina}")
stock_esg_rate_sina_dfThe structure of Sina Finance’s ESG data is shown below:
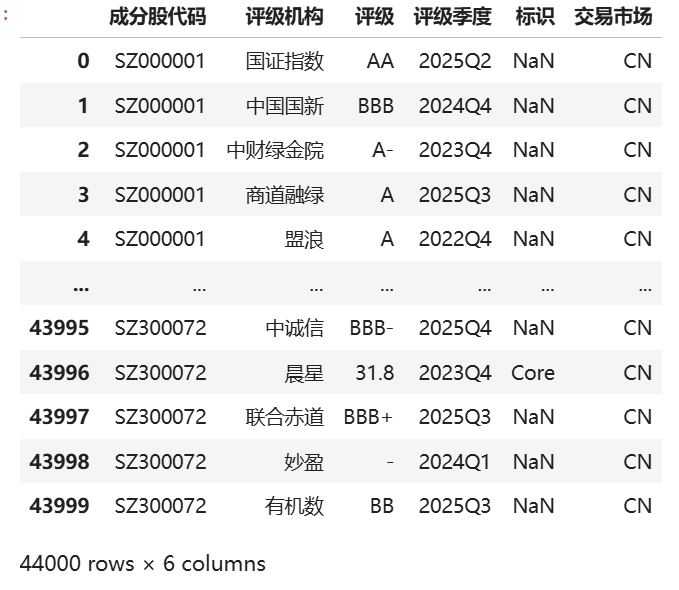
For analyzing this ESG data format, we typically have two approaches:
- From the perspective of rating agencies, splitting data from different agencies to compare differences in dimension division and scoring systems.
- Querying different evaluations from various rating agencies for a single stock.
We use China New Development Group (Zhongguo Guoxin) as an example:
rating_agencies = df['评级机构'].unique()
# 字典装机构
df_institution = {}
# 按评级机构分割数据
for agency in rating_agencies:
df_institution[agency] = df[df['评级机构'] == agency]
df_zhongxin = df_institution.get('中国国新') The data sample is as follows:

This allows us to intuitively see the ratings of various listed companies by Sina Finance.
What if we want to see all rating situations for a specific company? This is also achievable:
stock_lists = df['成分股代码'].unique()
# 字典装机构
df_stocks = {}
# 按评级机构分割数据
for stocks in stock_lists:
df_stocks[stocks] = df[df['成分股代码'] == stocks]
df_s = df_stocks.get('SZ300072')
df_s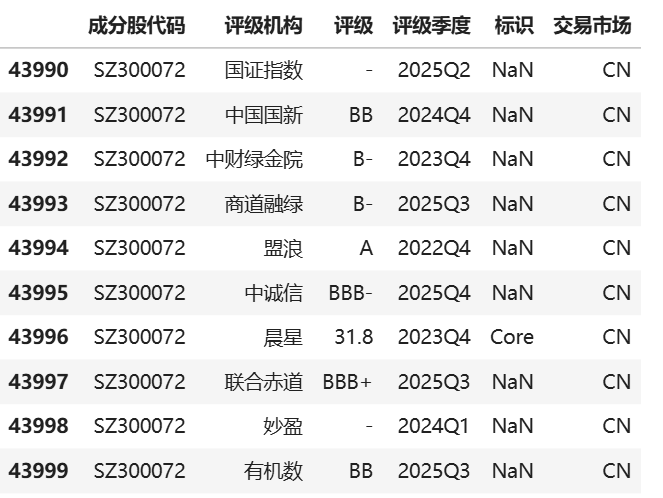
Thus, we have completely analyzed the download of Sina Finance’s ESG data from the Akshare database. The download methods for other sources are similar. Next, we will demonstrate the data characteristics of other rating agencies.
2.2. MSCI ESG Data
Use the following code snippet to retrieve MSCI ESG data:
stock_esg_msci_sina_df = ak.stock_esg_msci_sina() #msci
msci = data_home / "msci_esg_data.xlsx"
stock_esg_msci_sina_df.to_excel(msci, index=False)
print(f"File saved at: {msci}")
stock_esg_msci_sina_df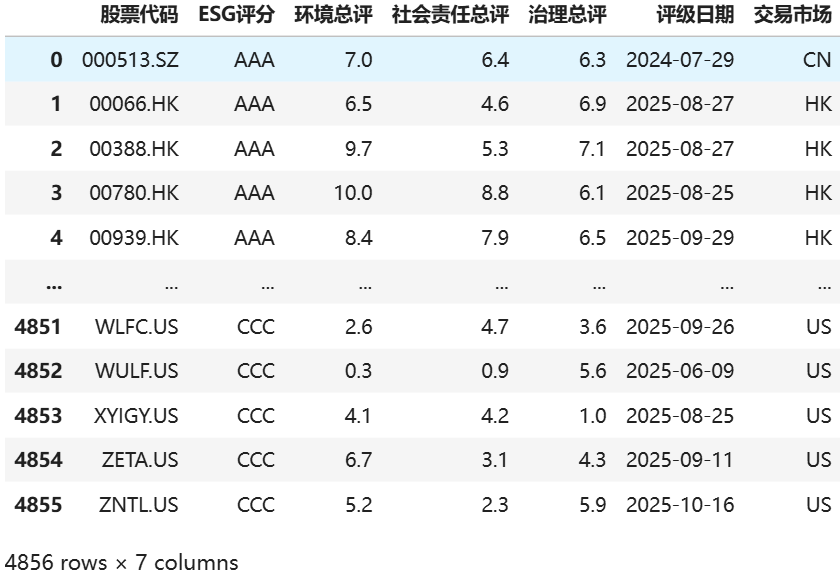
MSCI’s ratings cover companies across different markets. Its scoring content is detailed, offering both total ESG scores and individual item scores. If the data is complete, it is very suitable for subsequent quantitative analysis.
However, the sample size of domestic companies for this indicator is too small, making it unsuitable for our subsequent analysis.
2.3. Refinitiv (LSEG) ESG Data
Use the following code snippet to retrieve Refinitiv ESG data:
stock_esg_rft_sina_df = ak.stock_esg_rft_sina() #路孚特
rft = data_home / "rft_esg_data.xlsx"
stock_esg_rft_sina_df.to_excel(rft, index=False)
print(f"File saved at: {rft}")
stock_esg_rft_sina_df
Refinitiv adopts a form of joint disclosure of ratings and scores, but the information is limited. There is only cross-sectional information for 100 stocks, mostly overseas stocks, which is also unsuitable for subsequent research.
2.4. Huazheng (China Securities Index) ESG Data
stock_esg_zd_sina_df = ak.stock_esg_zd_sina() #秩鼎
zd = data_home / "zd_esg_data.xlsx"
stock_esg_zd_sina_df.to_excel(rft, index=False)
print(f"File saved at: {zd}")
stock_esg_zd_sina_df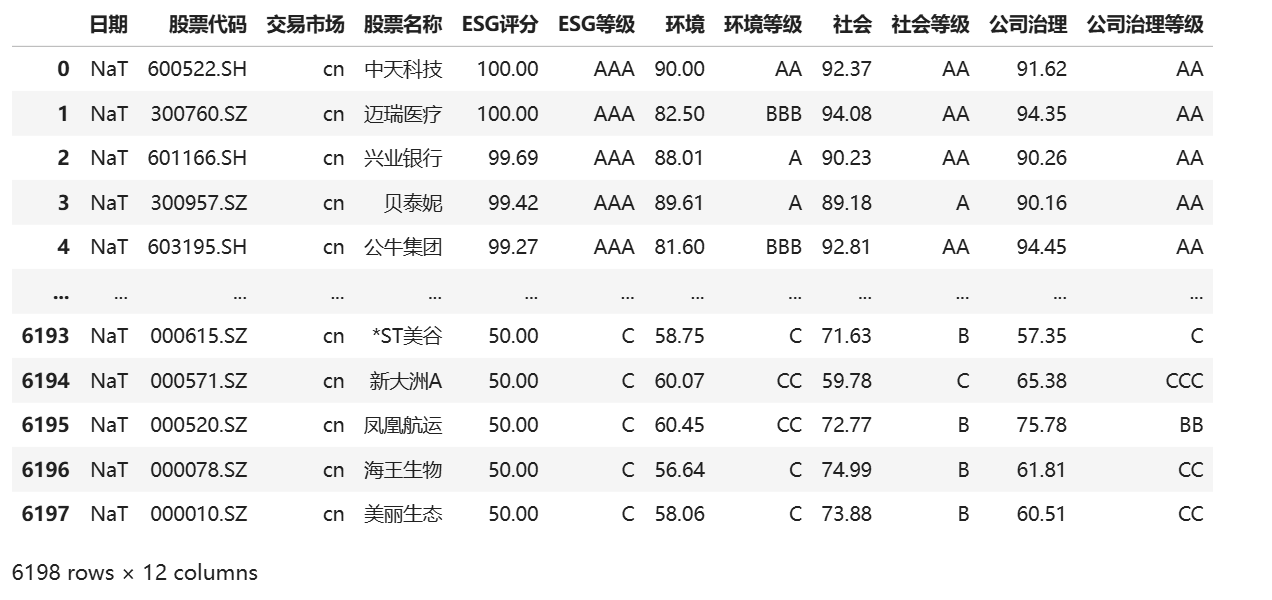
As seen, the Huazheng data obtained via Akshare is missing dates, possibly due to an API bug.
However, Huazheng ESG rating variables are complete: for domestic companies, it discloses scores from the total score to each individual item. Therefore, we have decided to use Huazheng data for subsequent strategy experiments.
2.5. Score Comparison
Next, we briefly summarize the above data:
| Source of Score | Rating Situation |
|---|---|
| Sina Finance | Covers multiple rating agencies; recommended to split and analyze separately. |
| MSCI | Total ESG score ranges from AAA to CCC; individual items have specific scores. |
| Refinitiv | Max score 100; both total ESG score and individual items are disclosed. |
| Huazheng | Max score 100; both total ESG score and individual items are detailed. |
3. Fund ESG Ratings
Next, we look at a simple application of ESG data: how to obtain a fund’s ESG ratings at different points in time. Currently, there are no good channels to directly obtain this data; we must use a “penetrative” approach to calculate the fund’s ESG rating ourselves.
As mentioned earlier, Huazheng’s data sub-items are relatively complete and more researchable. Therefore, we aim to calculate fund ESG ratings using Huazheng data. However, via Akshare’s API, we can only access the latest cross-sectional data, not historical data.
Thus, we separately downloaded the complete Huazheng rating data from a third-party channel. Readers can view these files on the Quantide Research platform.
Next, we begin estimating the ESG rating for the Huaxia Large Cap Select Mixed A (000011.OF) fund:
The main idea for rating is to weight the fund’s constituent stocks for a weighted calculation. Therefore, the first step is to know which stocks the fund holds, implemented using Tushare:
pro = ts.pro_api()
df_hold = pro.fund_portfolio(ts_code='000011.OF')
df_holdThe sample holding information is as follows:
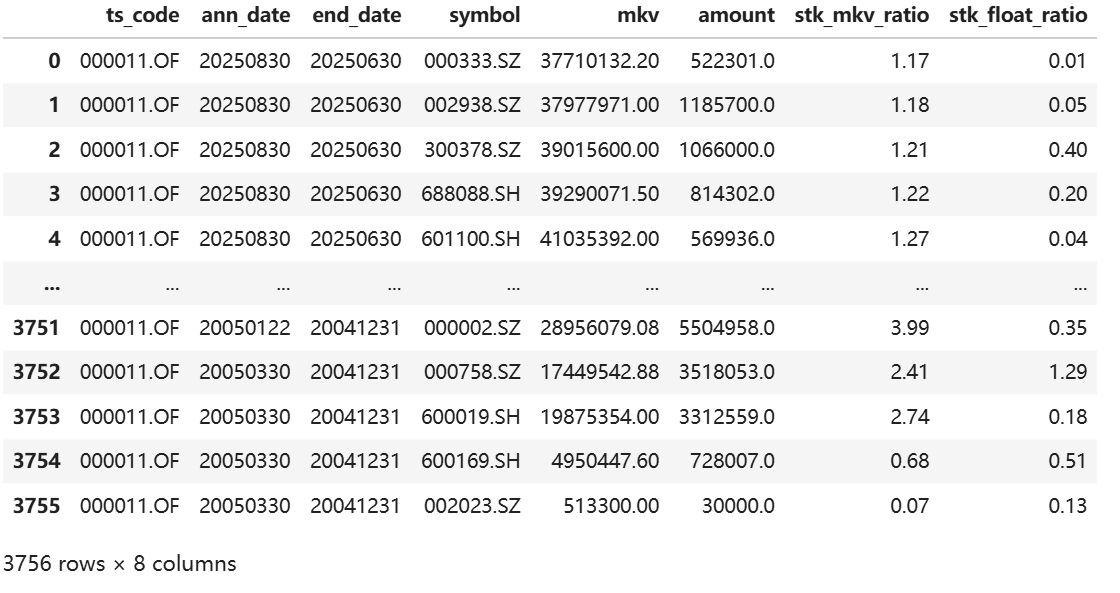
With the holding information, we match it with ESG data and perform a market-cap-weighted calculation to derive the fund’s ESG score over different periods.
import pandas as pd
import numpy as np
# ================= 0) 清洗函数 =================
def to_datetime_safe(s):
# 统一成字符串,去掉空白,把'--'、空串、'nan'统统变 NaT,再混合解析
s = s.astype(str).str.strip().replace({"--": None, "": None, "nan": None, "NaN": None})
return pd.to_datetime(s, errors="coerce", format="mixed")
def to_quarter_end(dt_series):
# 转成季度末日期(Timestamp,00:00时间)
q_end = dt_series.dt.to_period("Q").dt.to_timestamp(how="end")
return q_end.dt.normalize()
# ================= 1) 持仓(df_hold)日期与季度 =================
df_hold = df_hold.copy()
df_hold['end_date'] = to_datetime_safe(df_hold['end_date'])
df_hold['quarter'] = to_quarter_end(df_hold['end_date'])
# 仅保留需要列并汇总权重(市值)
hold_q = (df_hold
.dropna(subset=['symbol'])
[['ts_code','symbol','quarter','mkv']]
.groupby(['ts_code','symbol','quarter'], as_index=False)['mkv'].sum())
# ================= 2) ESG(df_esg)日期与季度 =================
df_esg = df_esg.copy()
# 标准化常见列名(你的表可能叫“证券代码”“评级日期”“综合评级”“综合得分”等)
rename_map = {
'证券代码':'股票代码',
'评级日期':'评级日期',
'综合评级':'华政评级',
'综合得分':'综合得分',
'E得分':'E得分', 'S得分':'S得分', 'G得分':'G得分'
}
df_esg.rename(columns={k:v for k,v in rename_map.items() if k in df_esg.columns}, inplace=True)
# 日期安全解析
df_esg['评级日期'] = to_datetime_safe(df_esg['评级日期'])
df_esg['quarter'] = to_quarter_end(df_esg['评级日期'])
# 只保留每股票每季度“最后一条”(按评级日期排序)
df_esg_sorted = df_esg.sort_values(['股票代码','quarter','评级日期'])
# 选出可用的得分列:优先综合得分,其次 E/S/G 平均;再不行才用字母评级映射
score_cols = [c for c in ['综合得分','E得分','S得分','G得分'] if c in df_esg_sorted.columns]
# 构造最终 esg_score
df_esg_sorted['esg_score'] = pd.to_numeric(df_esg_sorted['综合得分'], errors='coerce')
# 每股票每季度仅留最后一条
df_esg_q = (df_esg_sorted
.drop_duplicates(['股票代码','quarter'], keep='last')
[['股票代码','quarter','esg_score']])
# ================= 3) 合并并按持仓权重加权 =================
merged = hold_q.merge(df_esg_q.rename(columns={'股票代码':'symbol'}),
on=['symbol','quarter'], how='left')
def _weighted_score(g):
g_valid = g.dropna(subset=['esg_score']).copy()
if len(g_valid) == 0:
return pd.Series({'fund_esg_score': np.nan,
'coverage_weight': 0.0,
'n_positions': len(g),
'n_rated': 0})
w = g_valid['mkv'].values
w = w / w.sum()
s = float(np.dot(w, g_valid['esg_score'].values))
coverage = float(g_valid['mkv'].sum() / g['mkv'].sum())
return pd.Series({'fund_esg_score': s,
'coverage_weight': coverage,
'n_positions': len(g),
'n_rated': len(g_valid)})
fund_quarter_esg = (merged
.groupby(['ts_code','quarter'])
.apply(_weighted_score)
.reset_index()
.sort_values(['ts_code','quarter'])
)
fund_quarter_esgFinally, we can plot the historical ESG score trend for this fund:
x = pd.to_datetime(fund_quarter_esg['quarter'])
y = fund_quarter_esg['fund_esg_score']
# 3. 画图
plt.figure(figsize=(8,5))
plt.plot(x, y, marker='o')
plt.title('Fund_ESG_Score', fontsize=14)
plt.xlabel('quarter')
plt.ylabel('ESG_Score')
plt.grid(True, ls='--', alpha=0.4)
plt.xticks(rotation=45)
plt.tight_layout()
plt.show()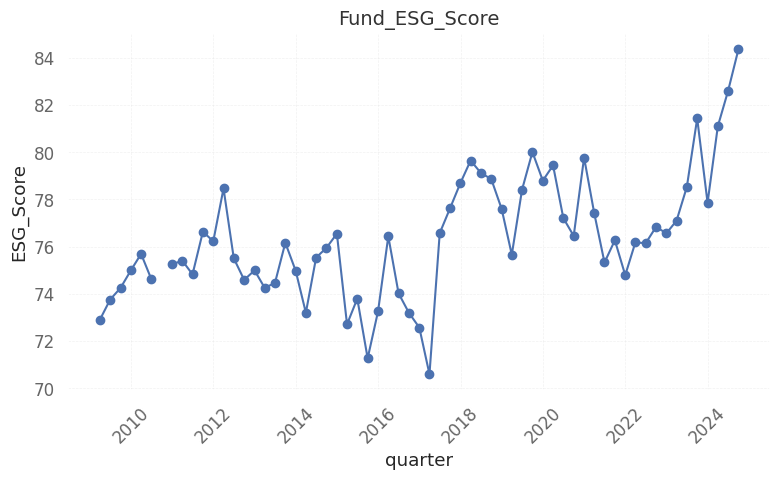
To obtain the complete code, please subscribe to the Quantide Research platform membership. Platform introduction and payment methods are available at https://mp.weixin.qq.com/s/j1r-cH_3Agc7fz1WwGrYFQ