
5-Minute ORB on Hot Stocks: 36% Annualized Alpha
This strategy comes from Carlo Zarattini et al., third-place winners at the Quantpedia 2023 competition. Studying the last six years of US equities, they found that a 5-minute ORB focused on Stocks in Play delivered over 1,600% in total net return, with a Sharpe of 2.81 and 36% annualized alpha. The S&P 500 returned just 198% over the same period.
The strategy is brutally simple — just relative volume, ATR, and a 5-minute breakout. Years ago, a friend used machine learning to build a strategy that doubled in two weeks, and I never asked him for the implementation details. But judging from his rebalancing records, the end result was remarkably close to this.
The ORB strategy was first introduced by Toby Crabel in 1990 in his book Day trading with short term price patterns and opening range breakout, which laid out the strategy and its systematic implementation in detail. Since then, both practitioners and academics have kept exploring and refining it.
In 2023, Carlo Zarattini et al. added a Stocks in Play filter to ORB, lifting the Sharpe to 2.81 and annualized alpha to an astonishing 36% (net of trading costs — for reference, Buffett runs around 20%, Medallion around 39%).
Stock Filter
The Zarattini strategy uses the following filters:
- Opening price above $5.
- 14-day average volume above 1 million shares
- 14-day ATR above $0.5
- Relative volume of at least 2, and
- Only trade the top 20 names by relative volume
Trade Execution
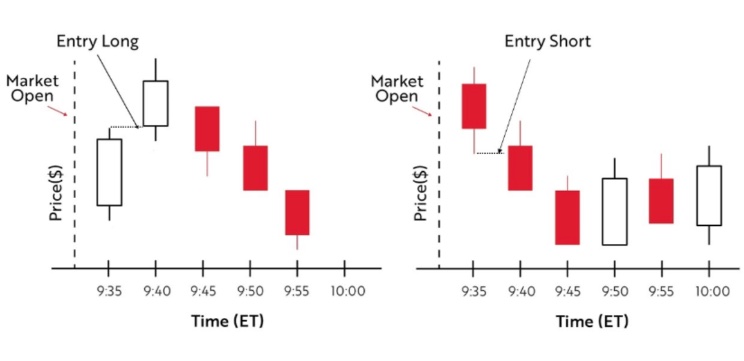
Use the direction of the first 5 minutes after the open to set the day's trading direction. For example, if the first 5-minute bar is bullish, only consider going long that name; otherwise go short. If the first 5-minute bar is bullish, you don't short even if price later breaks down.
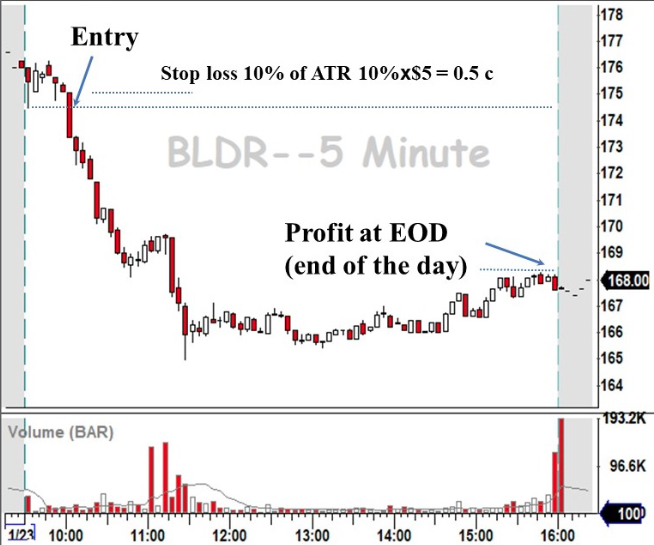
In the chart above (note: solid red is a bearish candle, hollow is bullish), the stock opened with a bearish candle, so the bias for the day is short. At 10am, price breaks down below the first 5-minute low, triggering a short entry, with a stop placed 10% of ATR away. The position is closed into the close.
The chart below shows two more examples, one long and one short, and when to enter. The left-hand example is a useful reminder that not every entry wins — risk is still very real.
If you're still waiting for me to say more about this strategy, sorry. I'm done.
Simplicity is the ultimate sophistication.
Forgive me for borrowing a cliché from the guru crowd. But since we're quants, we need at least some theory. Now comes the moment for math formulas and financial theory.
Why it works?
The key to the Zarattini strategy isn't ORB itself, but the filters that isolate a unique universe. Every resident of that universe is a high-energy particle with plenty of volatility.
Plus, with T+0 in US stocks and the ability to short, you can cut losses and let winners run (using ATR-based position sizing to limit the portfolio impact of any single loser to under 1%).
tip
China A-shares have no T+0 and no easy single-stock shorting (not every broker can locate shares), but that doesn't mean this strategy can't be applied to A-shares.Price above $5 needs little explanation — penny stocks are cheap for a reason.
14-day average volume above 1 million shares has many interpretations, but for short-term trading its job is simple: ensure active trading so market impact stays manageable.
14-day ATR above $0.5 ensures the stock actually moves. ATR is an absolute value — you can also normalize it by the 20-day moving average to get a percentage-based threshold that works across all names.
Rules 4 and 5 are the fighter jets of the stock filter! Relative volume is the key — the signal emitter that picks out Stocks in Play in one move. Rule 4 mainly ensures you still get qualifying names even when the overall market is quiet.
If you follow retail trading gurus, you've probably heard this morning routine for picking stocks:
quote
During the opening auction, add the top 10 names by relative volume to your watchlist, watch until 10:50, and buy those that are up but no more than 3%, and hold above VWAP on dips!If there weren't some logic to these tips, they wouldn't fool anyone.
Zarattini et al., using extensive data, found a statistical link between relative volume and profitability (both long and short), vindicating those veteran stock-pickers. See below:
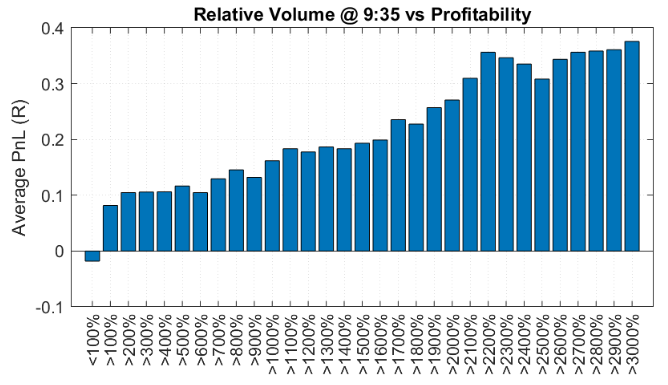
Relative volume here is exactly what you'd expect. For rigor, here is their exact formula:
$$ RelativeVolume_{t,j} = \frac{ORVolume_{t,j}}{\frac{1}{14}\sum_{i=1}^{14}ORVolume_{t-i,j}} $$
Here $ORVolume_{t,j}$ is the volume of stock $j$ in the first 5 minutes on day $t$, while $ORVolume_{t-i,j}$ is the first-5-minute volume of stock $j$ on day $t-i$.
From the data, only picking names with relative volume above 30x looks more efficient. But according to Zarattini, that would cut down the number of trades per year so much that total profit would fall.
Beyond the statistics, I care more about the economics and game theory behind the strategy. What does a spike in relative volume actually mean? If we figure that out, we'll know whether this key factor will decay, and if so, when.
Using one factor well matters more than mining new ones. Because simplicity rules — when you get down to it, there are only a handful of things that drive stocks higher.
Among experienced short-term traders, there has always been a mantra: only trade hot stocks. A company can become a Stock in Play on news like:
- Better-than-expected earnings release or pre-announcement.
- Approval or rejection of a patent, drug, or license.
- Restructuring and M&A, or a new strategic alliance or partnership.
- Major product launch, winning a major contract or client (or losing a bid).
- Management change
- Stock split (in A-shares: bonus shares), buyback, or bond issuance
- Break of a key technical level.
Except for point 7, all of them carry information about changes in earning power. Once that information is out, it draws attention and reminds people to trade the stock. Whether the news hits during market hours or after the close, people have all evening to receive it, digest it, and plan for the next morning.
So if a company drops breaking news one day, next-day volume will almost certainly be much larger than the day before; conversely, if a stock's volume suddenly explodes, it usually means surprisingly good or bad news just came out.
How do you predict what that news means for direction? Analysts usually talk their book — don't listen to them. And don't analyze it yourself either, because in stocks, being right doesn't help if everyone else is wrong and you're right in vain.
The ORB strategy tells us: watch the direction of the first 5 minutes. If it's a bullish candle, lean long; if it's bearish, lean short.
The market is naked money democracy. People vote with money on direction, very sincerely.
Why insist on relative volume? Because if volume doesn't expand meaningfully on a long signal, you're still trading against incumbent money, and incumbents love to paint the tape. Only when a flood of outside money pours in is the direction set by the money game real.
If someone wants to reverse that direction, they'd have to put up even more money. He wants to show off, but his wallet won't allow it. Direction set this way is like a playboy's love — it may be brief, but every time it's sincere.
Now, do you still want to run text mining with large models to forecast? Or are you starting to believe that all signals are already hidden in price and volume?
Seeing is believing, but doing is knowing. In the Quantide environment, we provide minute-level data going back to 2005 with minute-level backtest support — you can try this strategy yourself.
tip
For fans of random walk and EMH. These theories have no place in equity markets (though they hold up in futures and options).People who stay up late don't see the morning news. Market participants can never receive, digest, and react to this information at the same time.
Profits earned from running real businesses keep flowing into the stock market, so the market as a whole points upward (Myanmar excepted, of course).
Over long horizons, it advances faster than GDP growth, because the market should集聚 a country's best companies.
To achieve the returns and low risk described in the paper, you need two things. First, T+0 stop-losses. The second has nothing to do with the market: you need a quantitative trading system that can compute 5-minute relative volume for the entire market quickly, fire orders fast, and stop out with one click. The original paper covers shorting, but long-only is OK too.
In A-shares, however, we can't stop out on T+0, which amplifies some risk. If possible, consider convertible bonds.
The original paper (PDF) also studies ORB across different time windows (10, 15, 30 minutes, etc.) and compares performance with and without the relative-volume constraint. If you'd like a copy of the original, please share this article and message us to request it.