
Factor 42: 17.6% Annualized, 10x in 15 Years

101 Alpha Formulas is a paper published by Zura Kahushadze in 2015. In it, he compiled approximately 80 factors widely used at WorldQuant that are suitable for formulaic representation, along with several self-developed factors, totaling 101. These were published as a preprint on arXiv.
The paper quickly garnered industry attention. Today, the Alpha101 factors have become a widely used, paid resource among domestic institutional investors. However, the formulas in Alpha101 are notoriously obscure, employing custom operators, numerous "magic numbers," and deeply nested parentheses, causing many practitioners to abandon them after a brief attempt.
However, giving up on Alpha101 would be a significant loss. For instance, we recently backtested Factor 42 and found it to perform exceptionally well in China A-shares.
info
The backtest uses data from 2008 to 2022, randomly selecting 2,000 individual stocks. Given that there were only about 1,800 stocks in China A-shares in 2018, this backtest covers nearly the entire market prior to 2018, making it highly representative.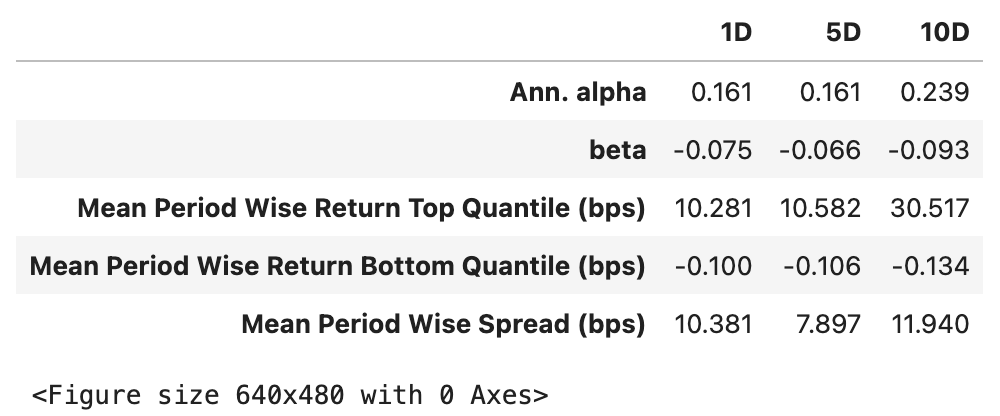
Nevertheless, mastering Alpha101 is not easy. It must be admitted that its formulas are somewhat晦涩 (obscure). Take Factor 29, for example, with the following formula:
(min(product(rank(rank(scale(log(sum(ts_min(rank(rank((-1 * rank(delta((close - 1),
5))))), 2), 1))))), 1), 5) + ts_rank(delay((-1 * returns), 6), 5))This represents a factor of medium readability within Alpha101. If we expand it, it looks like this:
(
min(
product(
rank(
rank(
scale(
log(
sum(
ts_min(
rank(rank((-1 * rank(delta((close - 1), 5))))), 2
),
1,
)
)
)
)
),
1,
),
5,
)
+ ts_rank(delay((-1 * returns), 6), 5)
)Not only is understanding its meaning difficult, but implementing it is also challenging. Moreover, Alpha101 contains many areas for optimization and a few errors (which is still a valuable resource for a free, public article). For example, Factor 42 still has room for improvement. Below is the performance of our refactored version (source code available only to students under identical conditions):
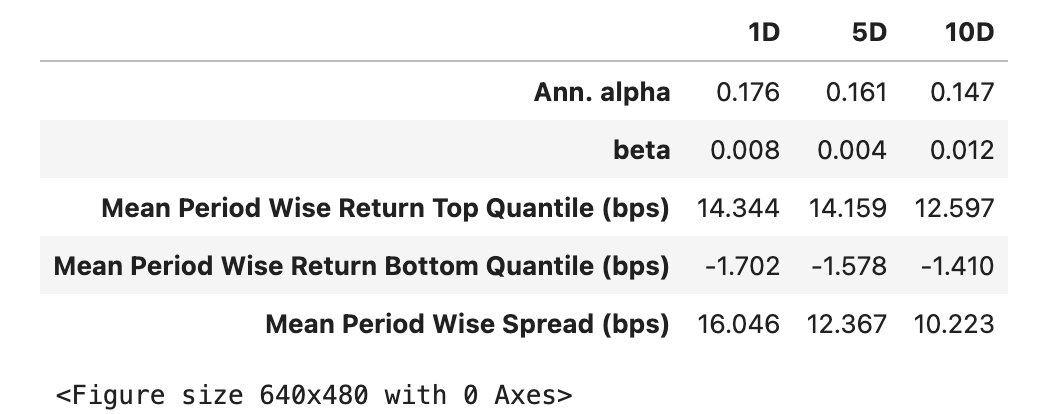
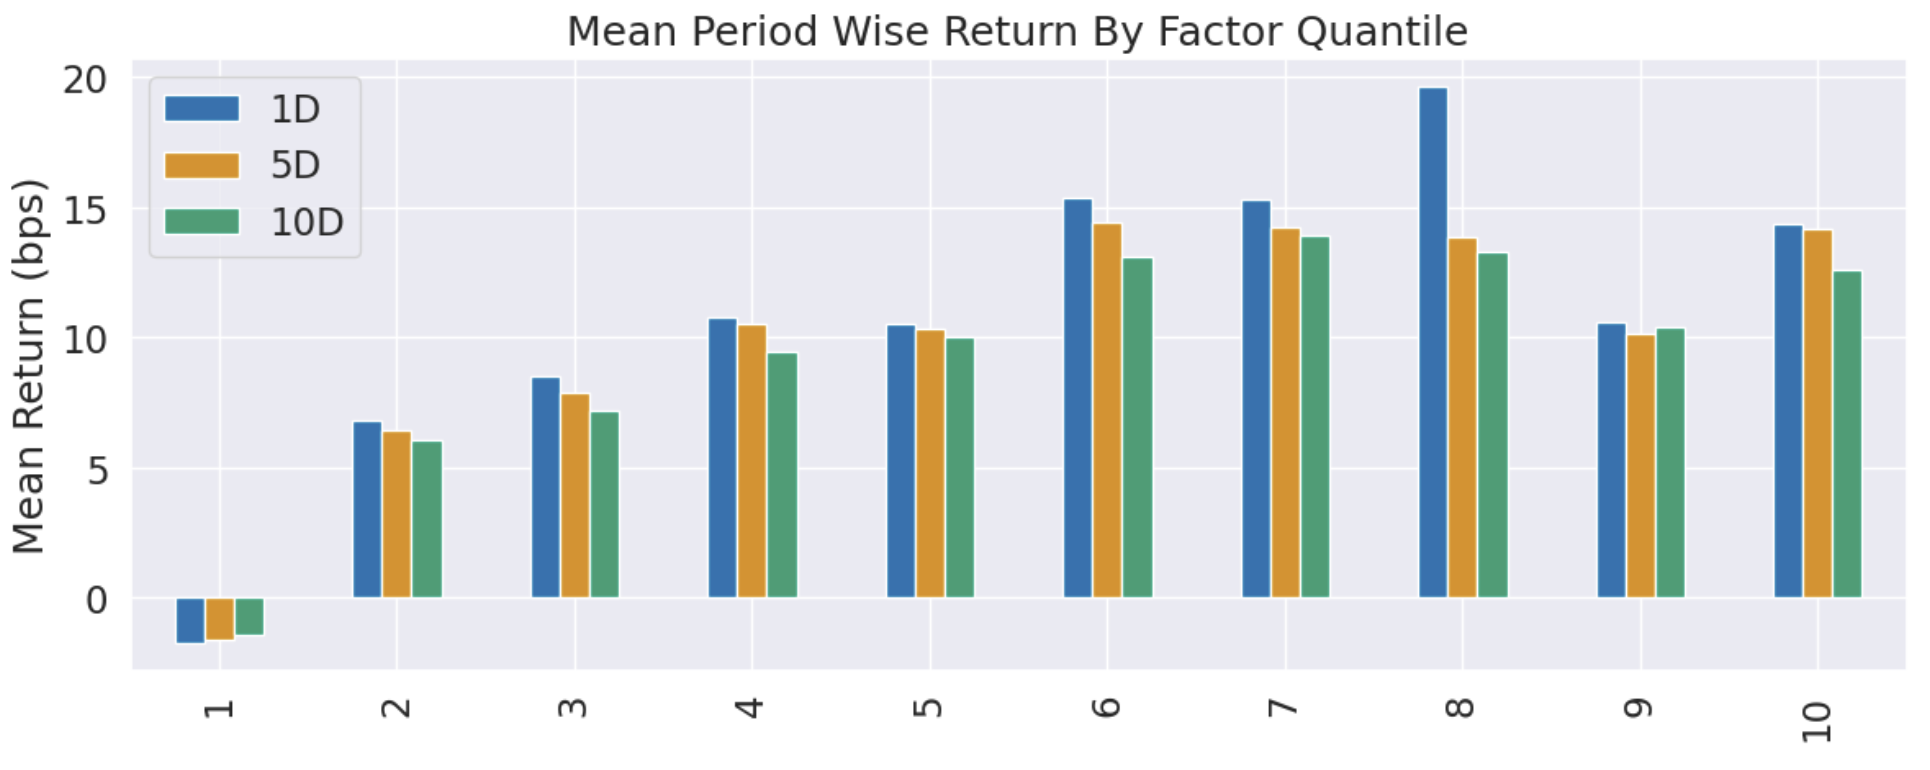
We observe a 1.5% increase in annualized alpha. The layer backtest (quantile) chart below is, to those in the know, simply perfect. Jim Simons’ notion of "following the beauty" likely refers to such charts.
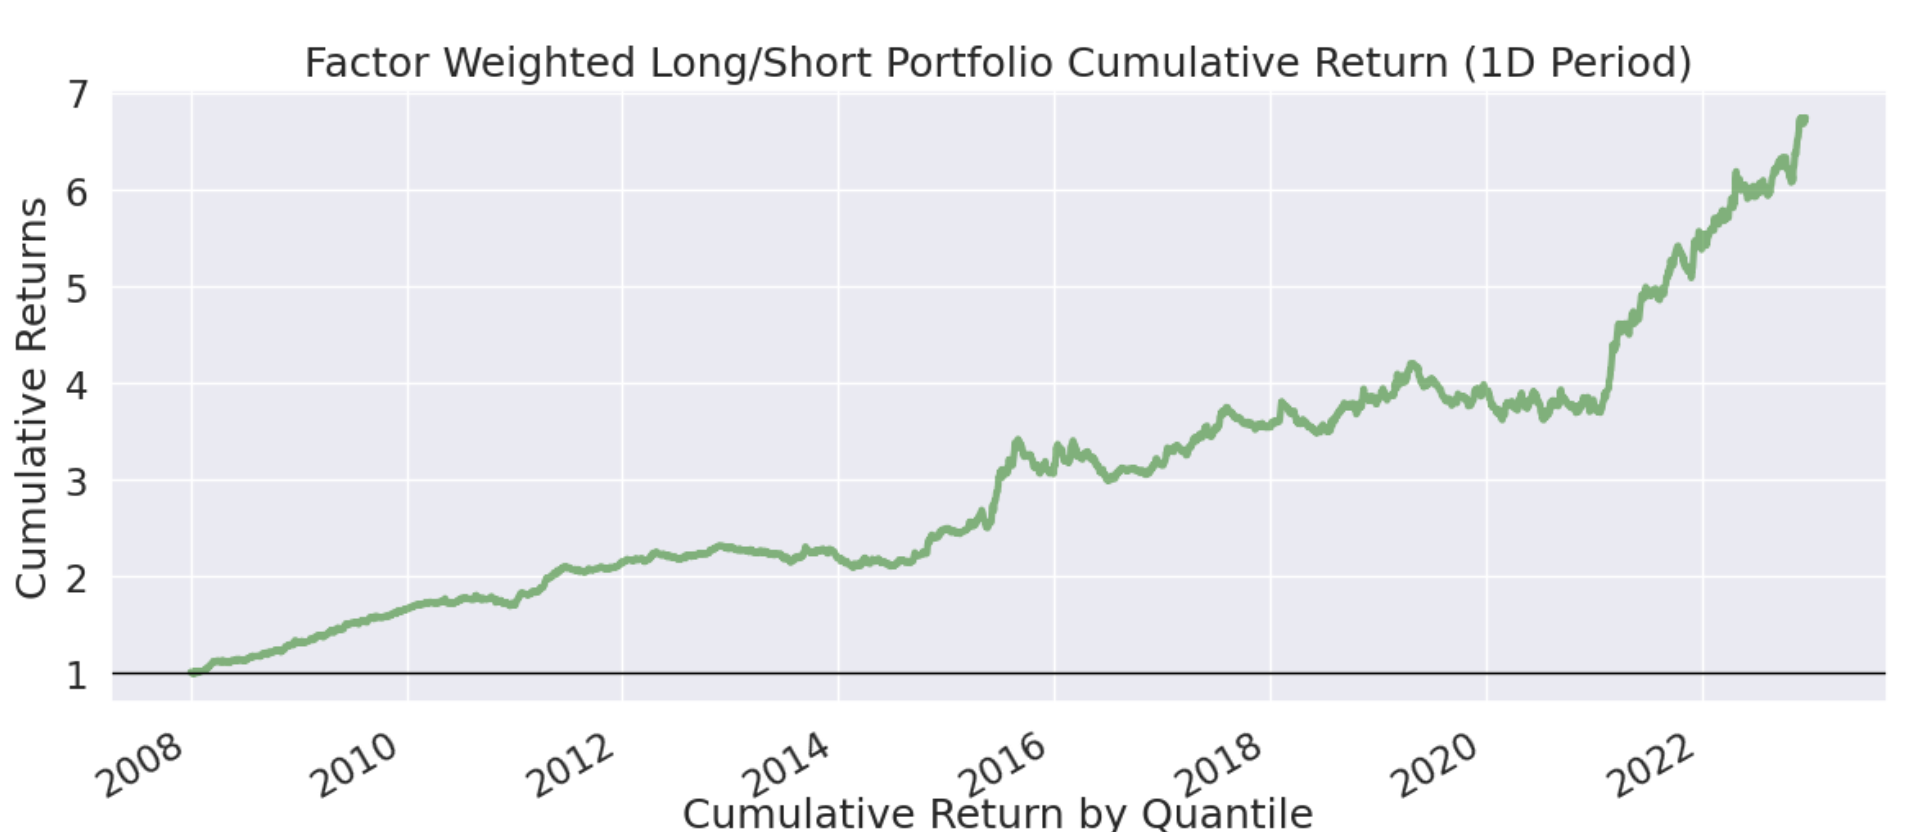
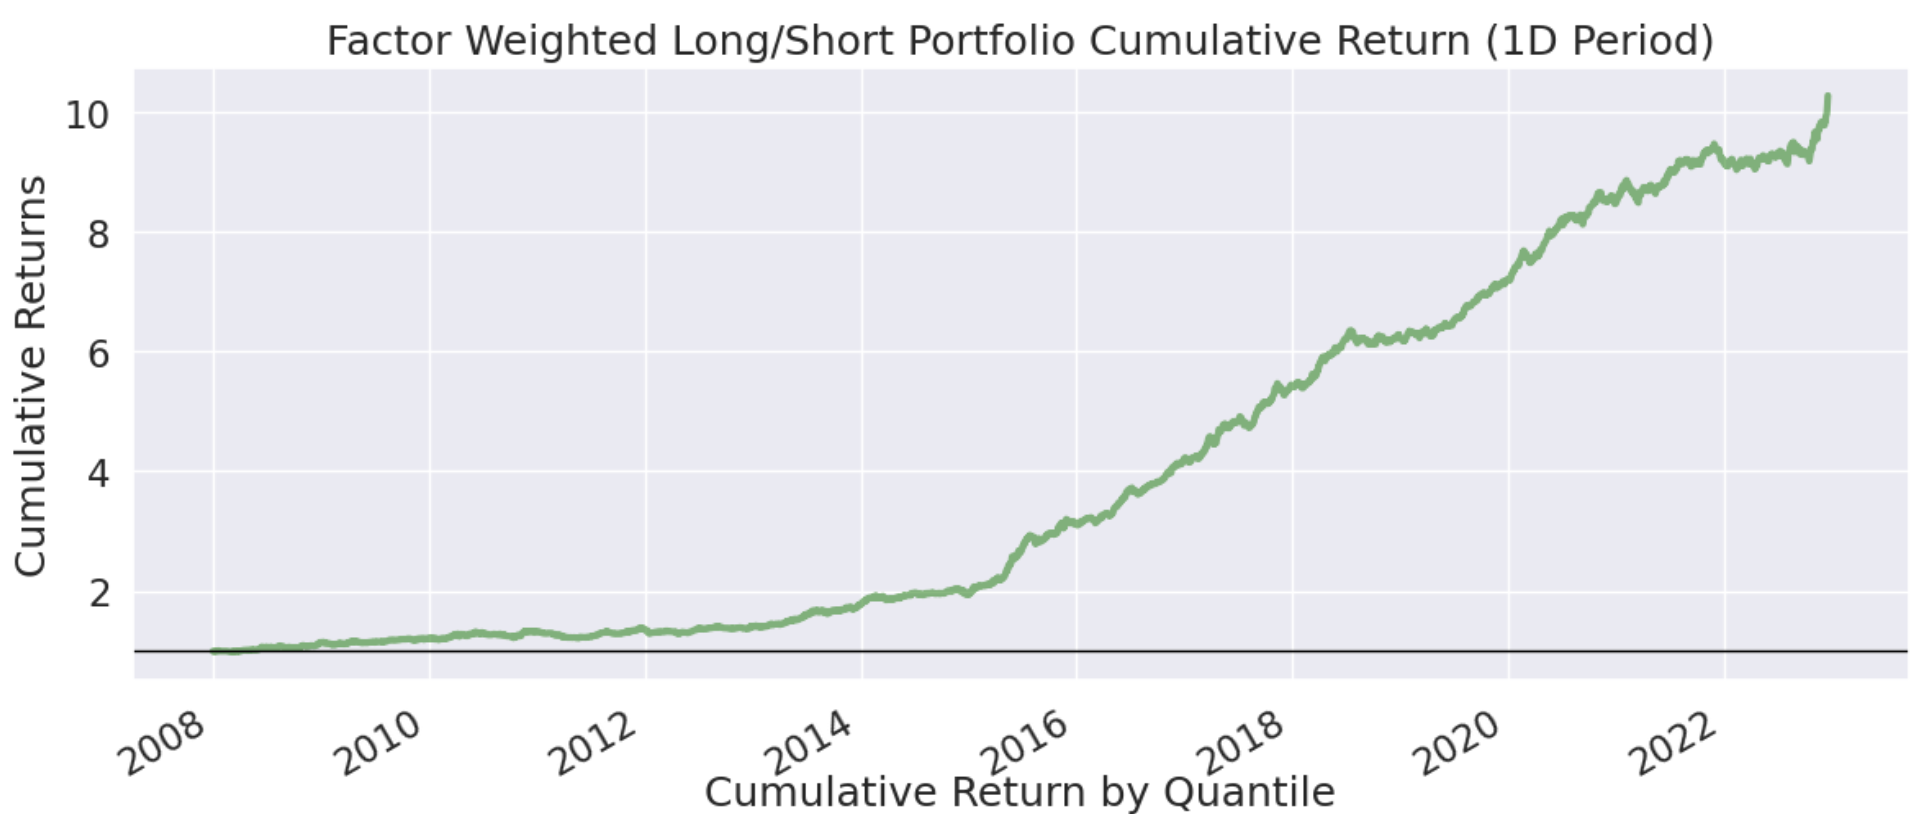
The cumulative return chart is equally impressive. After China A-shares peaked at 6,124 in 2008 and declined for several years, this factor’s returns continued to rise.
However, Alpha101 is indeed difficult to interpret. Consider Formula 001, which does not appear complex at first glance:
(rank(Ts_ArgMax(SignedPower((
(returns < 0) ? stddev(returns, 20) : close), 2.)
, 5)) -0.5)Yet, it performs many redundant operations. In essence, it ranks the current price’s distance from recent highs. Do you see it? So, is this factor actually effective? Under what circumstances does it yield unexpected results?
Furthermore, how should one go about factor testing—from formula to code, and finally to data integration? If you are interested, join us in learning together!