
Conners RSI: My Top Indicator Discovery of the Year
If you could build a strategy from a single factor alone in the multi-factor era — and still have a good chance of beating the market — this would be the one.
That factor is Conners RSI. Nirvana Systems calls it the ultimate technical indicator, and I couldn't agree more. Nirvana Systems published how to construct and use it on its website. Both the popular backtesting framework backtrader and TradingView ship with it built in.
Highly Recommended!
This article was originally published on Zhihu, where it earned over 800 likes and saves in a week. We have selected it as our year-end feature for Xiaohongshu. It is packed with detail — save it for future reference.Why is Conners RSI called the ultimate technical indicator? What are its advantages, what drives its success, and how do you implement it?
How to Build Conners RSI
Conners RSI blends the classic RSI with two additional components.
The first component is Streaks. It counts consecutive up or down periods, then applies the RSI formula to those streak counts. The code below shows how to calculate the Streaks indicator:
# 本段代码使用了较强的 NUMPY 技巧,建议反复研读
def streaks(close):
result = []
conds = [close[1:]>close[:-1], close[1:]<close[:-1]]
flags = np.select(conds, [1,-1], 0)
# FIND_RUNS 函数来自大富翁量化框架。它的作用是划分数组中
# 连续出现的相同值。是量化中非常基础的一个函数。
v, _, l = find_runs(flags)
for i in range(len(v)):
if v[i] == 0:
result.extend([0] * l[i])
else:
result.extend([v[i] * x for x in range(1, (l[i] + 1))])
return np.insert(result, 0, 0)The chart below shows daily closes and the resulting Streaks indicator:
The second component is the percent rank of today's return within returns over a lookback window. percent_rank is a common statistical function, already available in pandas. Here is a numpy implementation:
def percent_rank(close):
roc = close[1:]/close[:-1] - 1
return np.array([sum(roc[i + 1 - self.prank:i + 1] < roc[i]) / self.prank for i in range(len(roc))]) * 100Combined with the classic RSI, these two components form Conners RSI:
$$ CRSI = [RSI(6) + RSI(Streak, 2) + PercentRank(20)] / 3 $$
Why Conners RSI Should Work Better
Let's start with Streaks. The classic RSI is a score based on cumulative gains relative to cumulative absolute price movement — a quantitative measure. Streaks binarizes up versus down moves, making it more of a qualitative measure. Why add it?

Probabilistically, the longer a stock's winning streak, the more likely a reversal — i.e., a down day — becomes, and vice versa. Using the PDF/CDF approach introduced in our Data Analysis with Python lessons, you can estimate for yourself the probability of another up day after a stock has risen for N consecutive days.
Hint: you can also treat this directly as a normal distribution to get a theoretical answer. Repeated trials of a binary outcome converge to a normal distribution in the aggregate. See Galton Board for background.
In other words, Streaks captures corner cases the classic RSI misses, from a different angle but still using probabilistic reasoning!
Similarly, PercentRank describes current market strength from another dimension. If only 3 of the past 20 days had lower returns than today, today's relative strength is 15%, and the odds favor an up move tomorrow. If 17 of the past 20 days had lower returns than today, today's relative strength is 85%, and the odds of a down move increase.
If you know candlesticks and Elliott Wave Theory, you'll recognize the pattern: a sharp rally often means an accelerating blow-off top; a sharp sell-off often means an accelerating capitulation bottom, with a trend reversal highly likely to follow. PercentRank is the simplest — yet still reasonably accurate — way to quantify that process!
tip
Nirvana Systems created this indicator, but never analyzed its underlying logic as deeply as we do here. In fact, it is supported both by probability theory and by behavioral finance.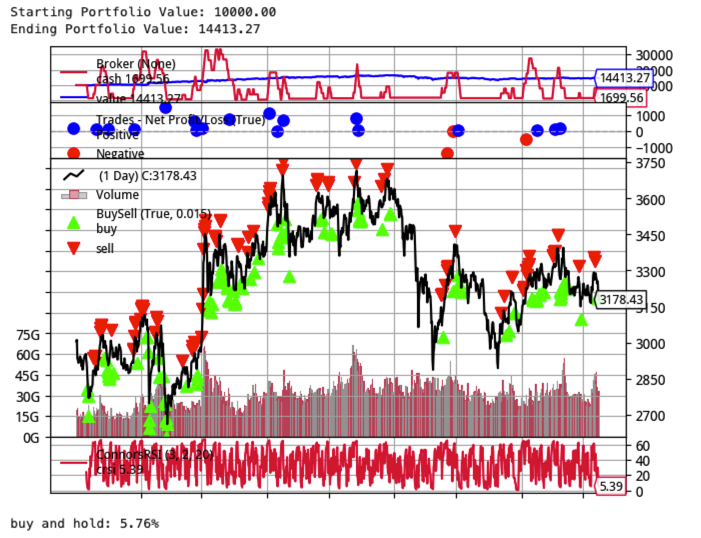
We first tested the Shanghai Composite Index over the most recent 1,000 days using backtrader. The backtest shows that over roughly the last 4 years — about 1,000 trading days — the index rose only 5.76%, yet a Conners RSI strategy of buying dips and selling rallies returned over 44% on the index. Applied to individual stocks, the gains could easily have been several times larger.
Since the index rose over this period, you might suspect the success of Conners RSI was just luck.
What if we had blindly picked a terrible market? How would Conners RSI hold up then?
The Hang Seng Index over the past two years is a perfect example — a classic falling knife:
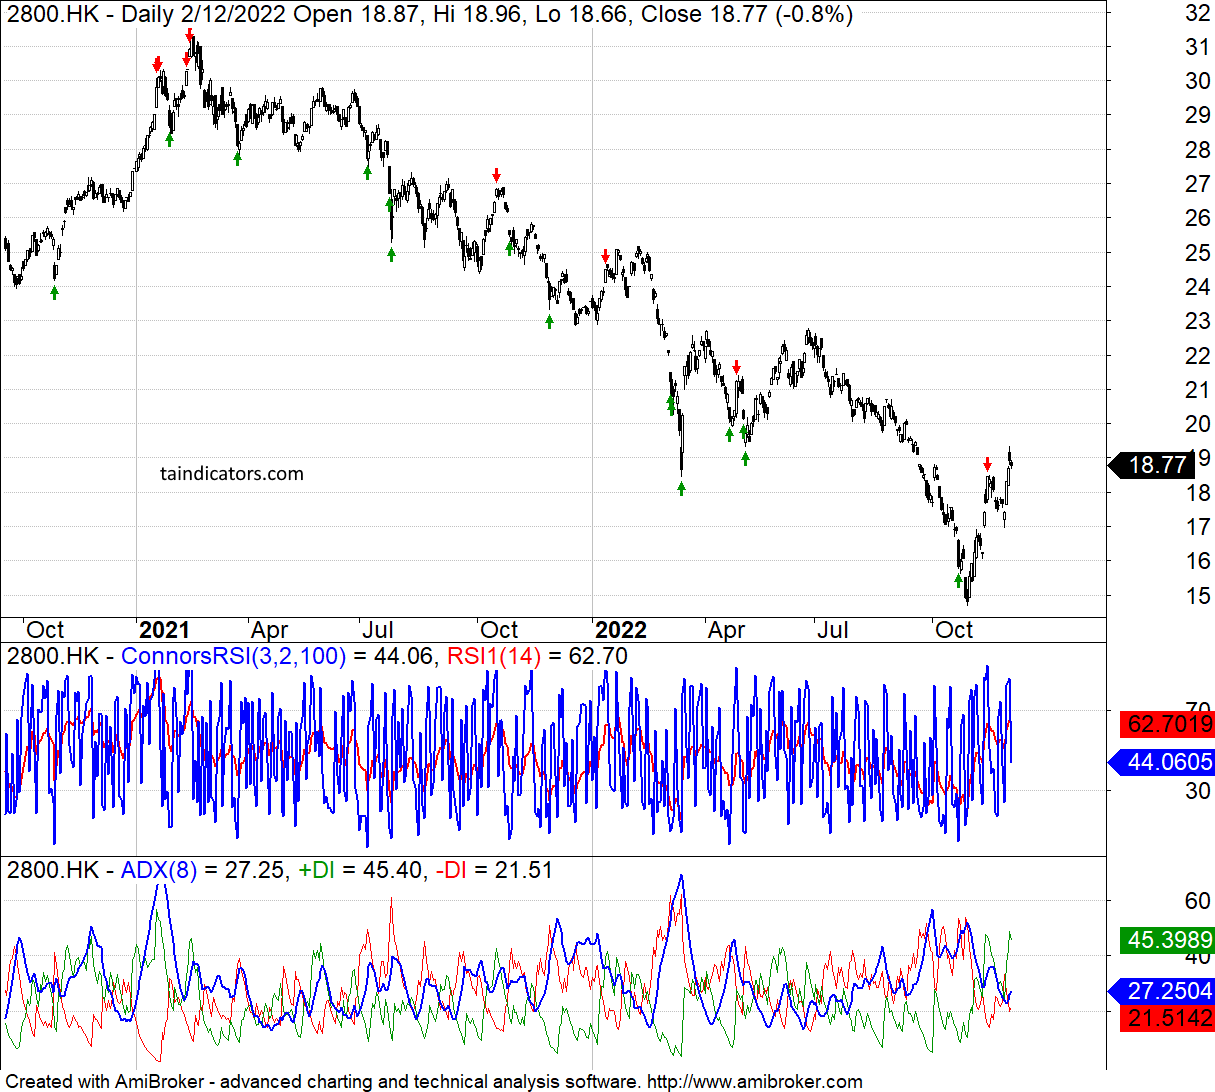
Of course, you generally should not try to catch a falling knife. But other traders' backtests show Conners RSI still managed to catch some rebounds while sidestepping some declines, performing considerably better than the index overall.
We also randomly selected some individual stocks and ran backtests with our own quantitative framework:
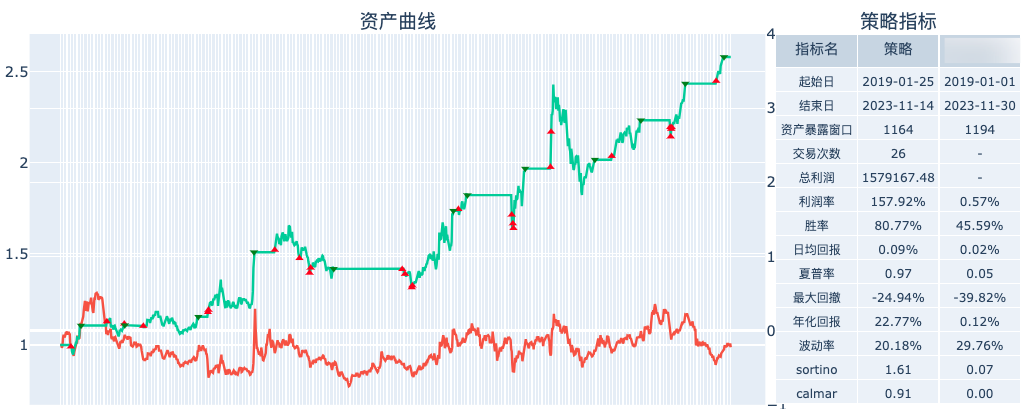
This stock traded sideways for almost a year. Buy-and-hold returned only 2.26%, while Conners RSI returned 12.14% with a 100% win rate.
We ran a backtest from January 25, 2019 to November 14, 2023. The stock chopped sideways for the entire period, yet Conners RSI delivered a 157.92% profit with an 80.77% win rate — nearly every signal paid off. It traded only 26 times and stayed in cash much of the time, so the idle capital could have been allocated to other names for even better overall returns.
Thinking Deeper About Conners RSI
Conners RSI is a brilliant discovery that reflects key ideas from probability theory and behavioral finance. But due to technical limitations at the time, its full potential was never unlocked.
Conners RSI takes data from three dimensions and averages them with equal weights. In traditional factor analysis, linear regression is the most widely used technique — and Conners RSI is essentially a linear regression. That was a method traditional finance was comfortable with.
Back then, machine learning was still unfamiliar to the finance world. Today, many will recognize Conners RSI for what it really is: a three-factor combination where machine learning can model the complex interactions and offsets among the three factors.
Nirvana Systems' extension of RSI also shows how we should treat classic technical indicators. Rather than simply labeling them good or bad — a trap the author once fell into — we should take a critical yet constructive approach, dig into how they work, and test whether new technology can give them new life. After all, every new discovery is ultimately a tribute to the classics!
Only when you reach that level can you claim truly independent thinking and stand on your own as a quant.
quote
Old soldiers never die, they just fade away. A tribute to WELLES WILDER and his RSI!