
Alphalens Factor Analysis (4): Information Coefficient
In previous notes, both return analysis and factor alpha were affected by trading costs. Information Analysis, by contrast, is immune to that effect, and its core tool is the Information Coefficient (IC).
The IC ranges from -1 to 1. The larger its absolute value, the stronger the correlation between the factor and returns; the smaller its absolute value, the smaller the factor's contribution to returns. So 0 means the factor contributes nothing to returns, 1 means a perfect linear relationship (good predictive power), and -1 means the factor is perfectly negatively correlated with returns — which is also a sign of strong predictive power.
We compute the factor IC with factor_information_coefficient:
from alphalens.performance import factor_information_coefficient
ic = factor_information_coefficient(factor_data)
ic.head()Of course, the best way to study a time series is still to visualize it:
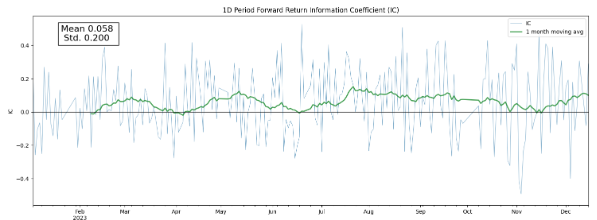
What can we read from this chart? The mean IC looks very close to zero. By the definition of IC, does that mean the low-turnover factor has almost no link to future moves and isn't worth considering?
Before jumping to conclusions, let's first look at the distribution of the IC we got:
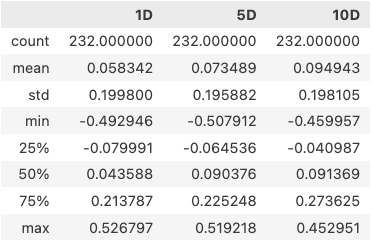
Its mean is only 0.058, and the maximum is only 0.52 — quite far from the ideal value of 1. But does that really mean the turnover factor doesn't work?
Let's first check what the best mean IC looks like in the JoinQuant factor library.
JoinQuant is a 10-billion-RMB hedge fund, and it also runs a crowdsourced platform similar to quantpian. Its website has a section called the Factor Dashboard. We listed all of its factors and sorted them by mean IC in descending order:
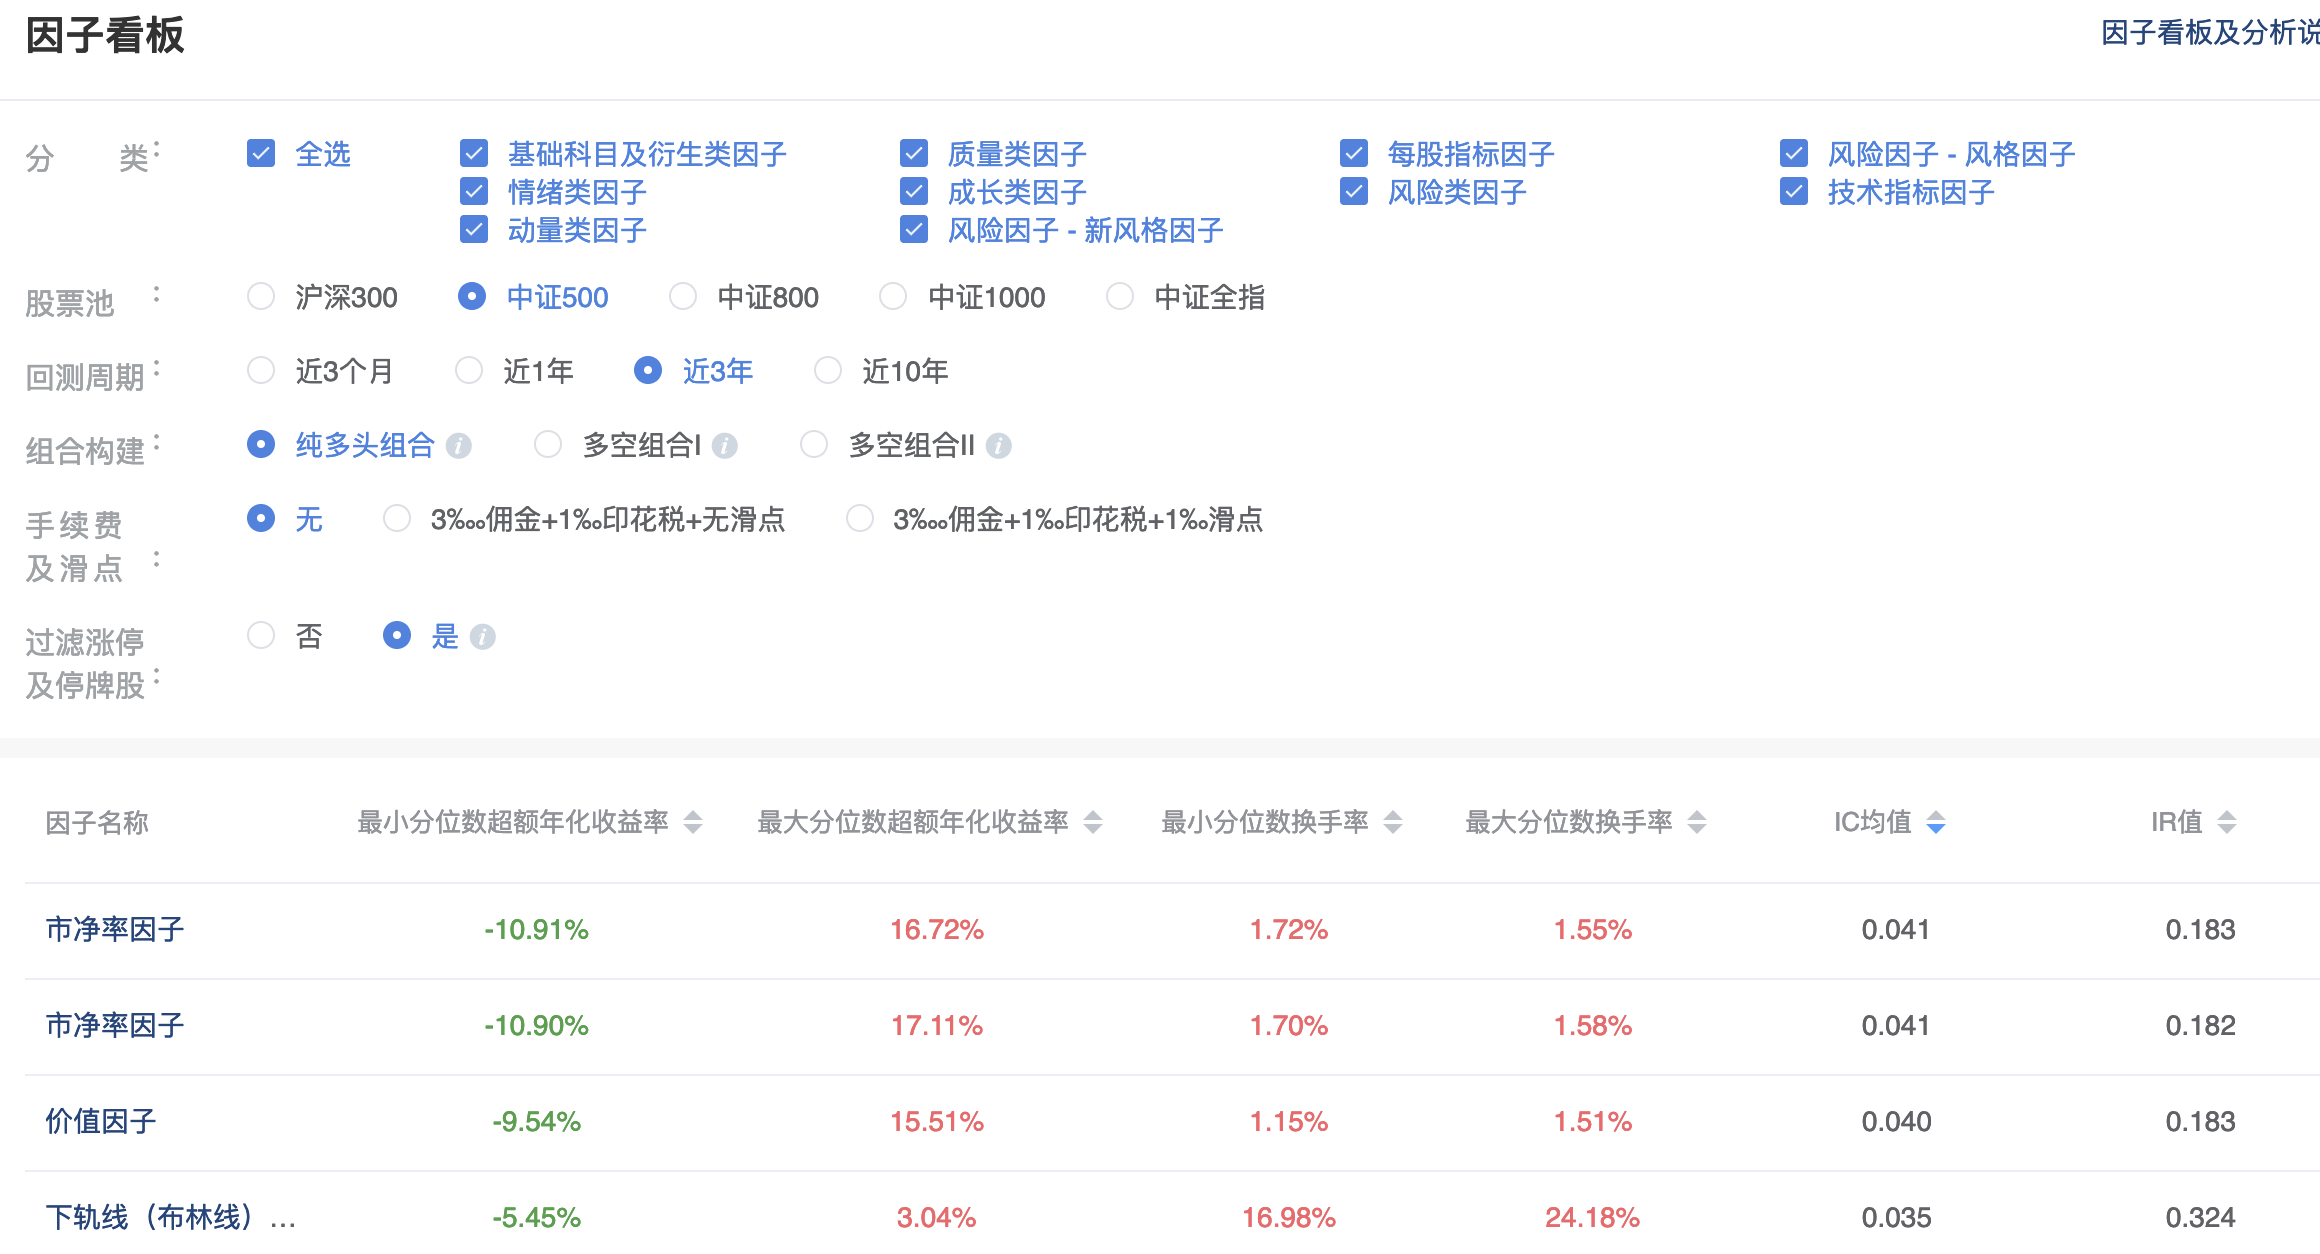
Among JoinQuant's three-year factors, the highest mean IC is 0.041, so our factor's predictive power already beats every factor in the JoinQuant library.
In fact, the JoinQuant library also favors turnover factors and includes several turnover-related factors, such as average monthly turnover by year, and 5-day, 20-day, 60-day, and 240-day average turnover.
Among them, the annual average monthly turnover factor has an IC of -0.035 with an annualized return of 13.39%. However, these factors are not open-source — we have no way of knowing how they are implemented, and can only guess from their names that they use turnover data.
Out of curiosity, we also put the question to GPT-4. We first confirmed we were talking to GPT-4 and that its knowledge cutoff was April 2023:
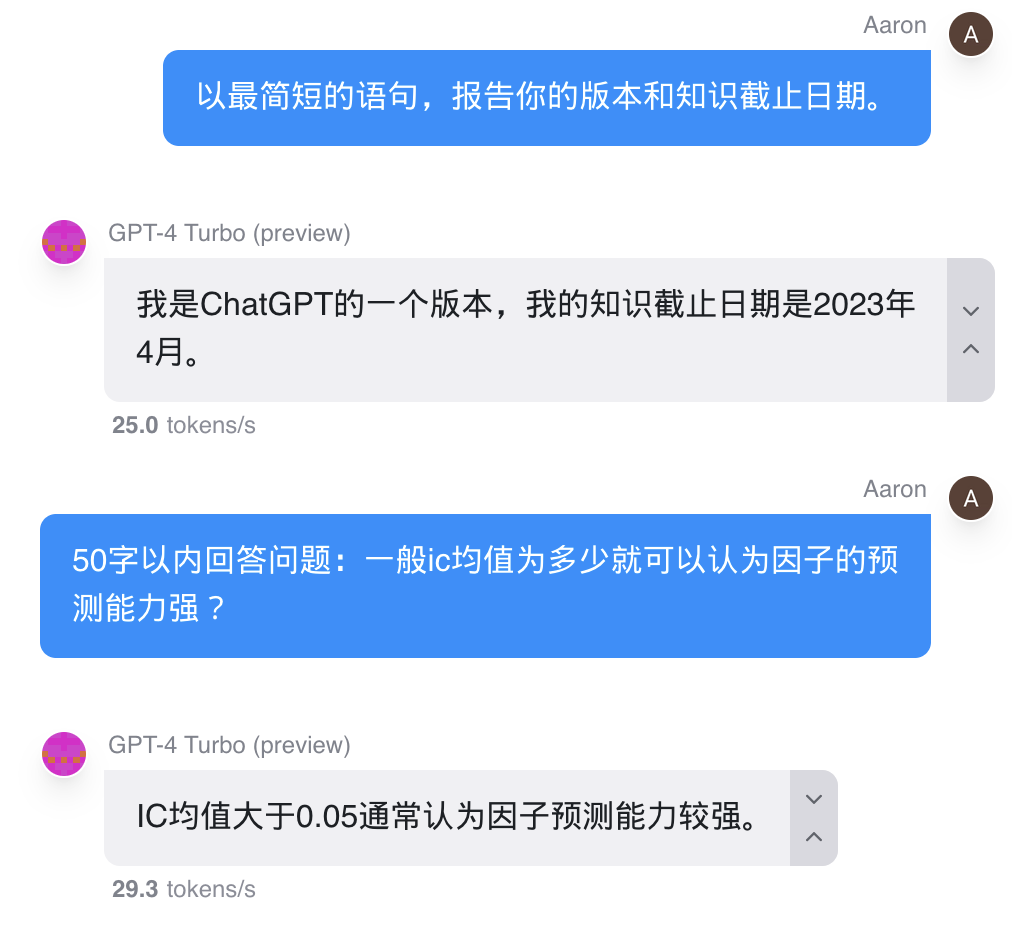
GPT-4's answer: a mean IC above 0.05 already indicates strong predictive power. While 1 is the theoretical optimum, 0.05 is the best you can realistically hope for in factor forecasting. High hopes, sobering reality.
When we use the mean of a random variable, we often worry whether a few outliers are driving it. We can gauge that with the standard deviation, but the most intuitive approach is a histogram or a QQ plot:
from alphalens.plotting import plot_ic_hist
plot_ic_hist(ic)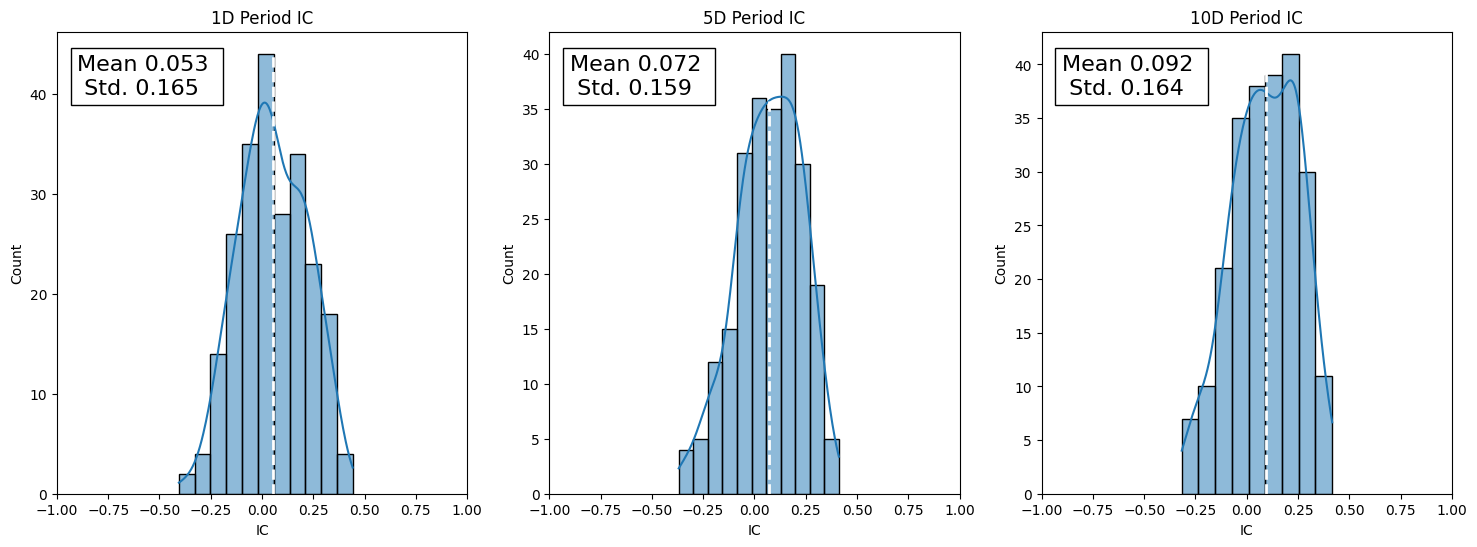
With a histogram, the key is to see how the IC behaves most of the time, where IC values are likely to deteriorate, and whether there are fat tails. It still takes a lot of experience to judge IC quality from a histogram alone. With a QQ plot, it is much easier:
from alphalens.plotting import plot_ic_qq
plot_ic_qq(ic)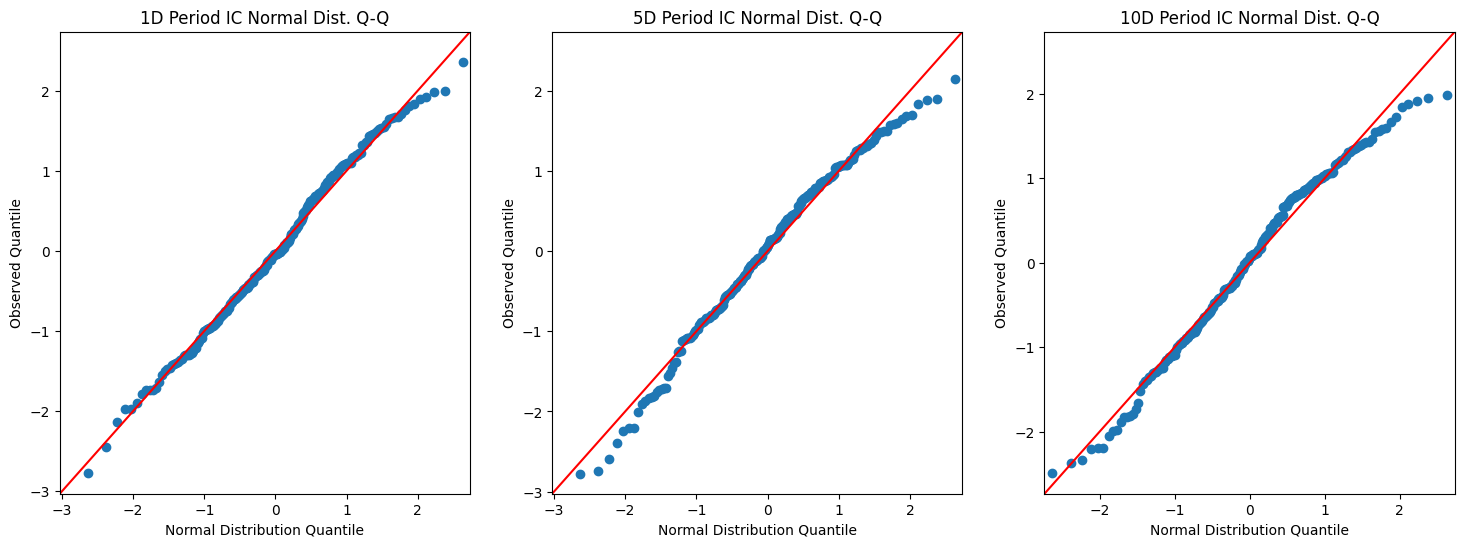
A QQ plot shows how the shape of the IC distribution differs from a normal distribution. It is especially helpful for understanding how the most extreme values in the distribution affect predictive power.
Judging from the QQ plot, the 1-day turnover factor performs quite well. Most points fall on the diagonal.
Finally, as a shortcut, Alphalens lets us call create_information_tear_sheet to get all the Information Analysis in one go:
from alphalens.tears import create_information_tear_sheet
create_information_tear_sheet(factor_data)This will reproduce all the charts in today's note in a single consolidated view.
The factor_data passed in here is the starting point for everything. We introduced it in the first note — it is built with get_clean_factor_and_forward_returns from the utils package.
KEY TAKEAWAY
1. IC analysis shows the correlation between factor and returns, free from trading-cost effects 2. An absolute mean IC of 0.02~0.05 indicates some predictive power. 3. An absolute mean IC above 0.05 indicates strong predictive power. 4. The 1-day low-turnover factor has an IC above 0.05.