
AI-Powered Mispriced Options: Skew Trading Without Code
This article introduces a method for using AI to discover mispriced options and how to trade them. Published just yesterday, it already garnered over 1.1k upvotes. It is well worth a read. The core value lies not in the strategy itself, but in demonstrating how AI can make complex options trading more accessible. Pay close attention to the prompts in the screenshots; translating them is not difficult.
attention
This article is a translation of a blog post by PandaMcGee3. You can find the original text and contact the author [here](https://www.reddit.com/r/options/comments/1o7prtk/my_method_on_making_money_trading_mispriced/).Reposting does not imply endorsement of the views herein. All rights belong to the original author. The first-person narrative below belongs to the original author.
About six months ago, I grew tired of this guessing game and decided to truly learn the mathematics behind options pricing. Slowly, I began building my own strategies. With the help of Artificial Intelligence, I can confidently say that my profitability is now quite decent. More importantly, I finally feel I have a deep understanding of the options market.
This is the article I wish I had seen when starting my options trading journey. It primarily covers the strategies I currently use, along with some more basic concepts. If you are more experienced, you may skip certain sections.
What Is Volatility Skew (And Why It Exists)
Think of options pricing like Las Vegas setting odds for the NBA Finals. Bookmakers first set odds based on expert predictions, then adjust them as the season progresses and betting volume increases. Options function similarly: market makers use the Black-Scholes model as a baseline, then adjust prices based on real-time market conditions.
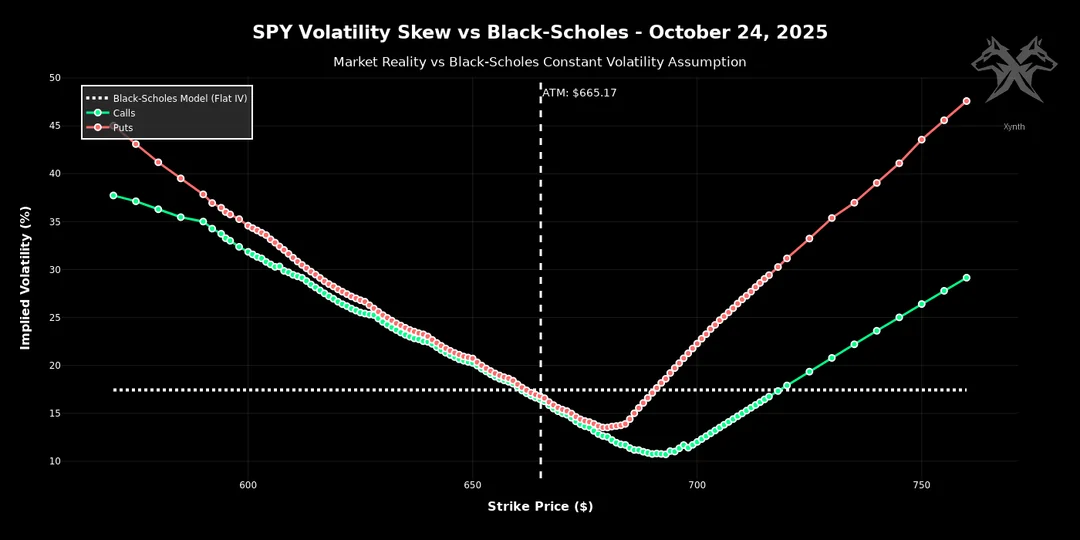
The key point is: Black-Scholes assumes that implied volatility (IV) should remain constant across all strike prices. Theoretically, far out-of-the-money (OTM) calls and at-the-money (ATM) calls should have the same implied volatility, as they are investing in the same underlying stock.
But reality is different. The implied volatility (IV) of OTM options is consistently higher than that of ATM options. Plotting this curve reveals the volatility skew. I know what you’re thinking: isn’t this normal? After all, odds change as the season progresses, right? You are correct; this is entirely normal market behavior.
Our opportunity arises when fear or greed pushes this tendency to extremes. When market makers raise prices due to panic buying of puts or FOMO-driven buying of calls, you see abnormally rich skew. This is exactly what we are looking for.
How To Find Options With Significant Skew?
Not all skew is created equal. As mentioned earlier, most skew is perfectly normal and reasonably priced. The key is having a system/criteria to help you consistently identify more significant/abnormal skew.
attention
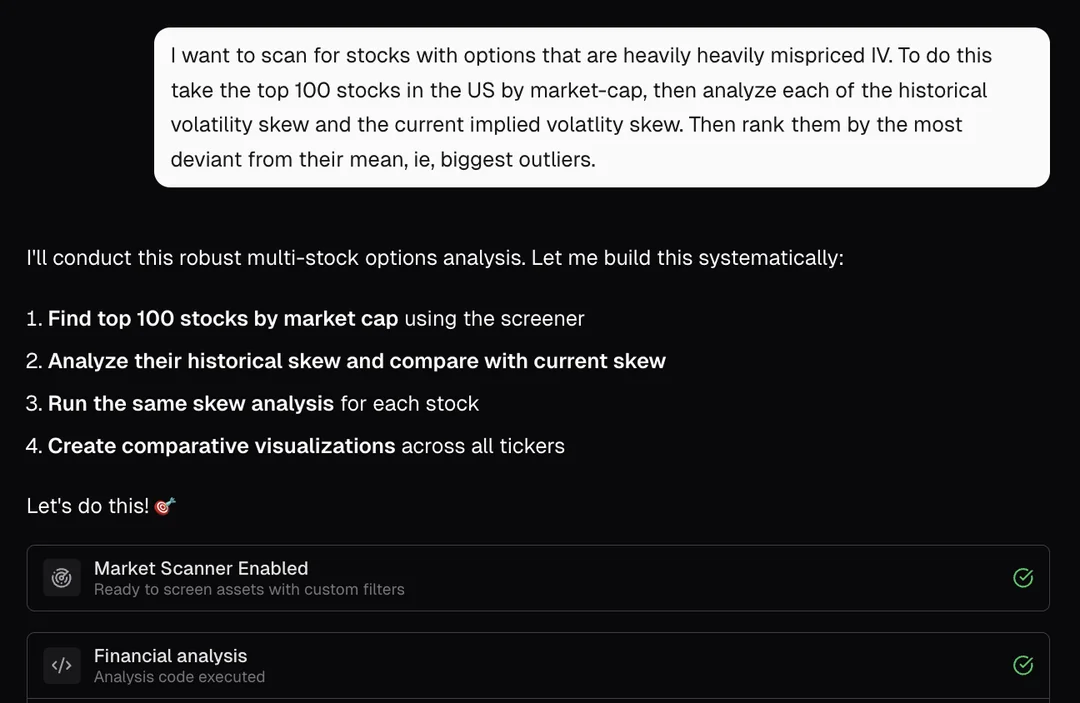
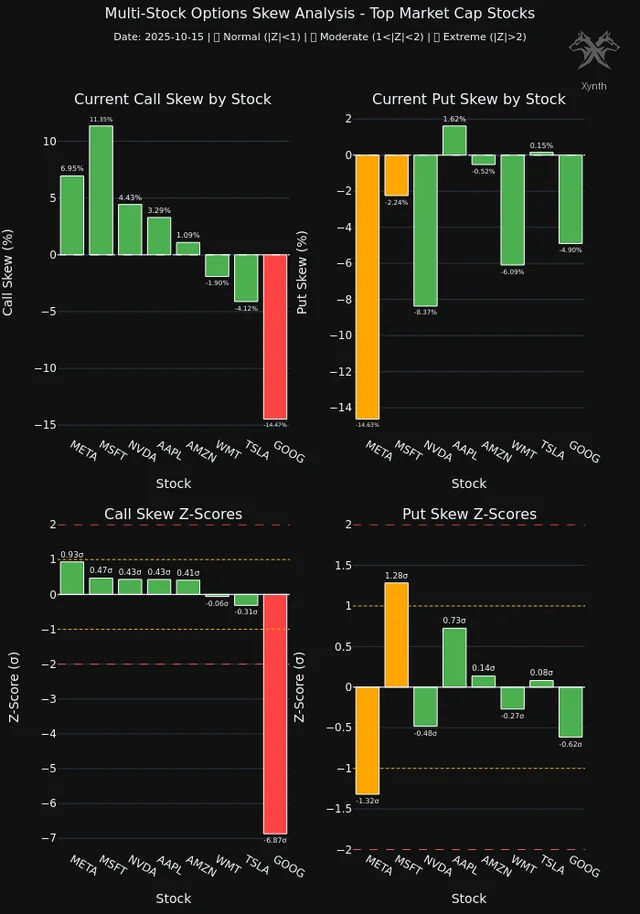
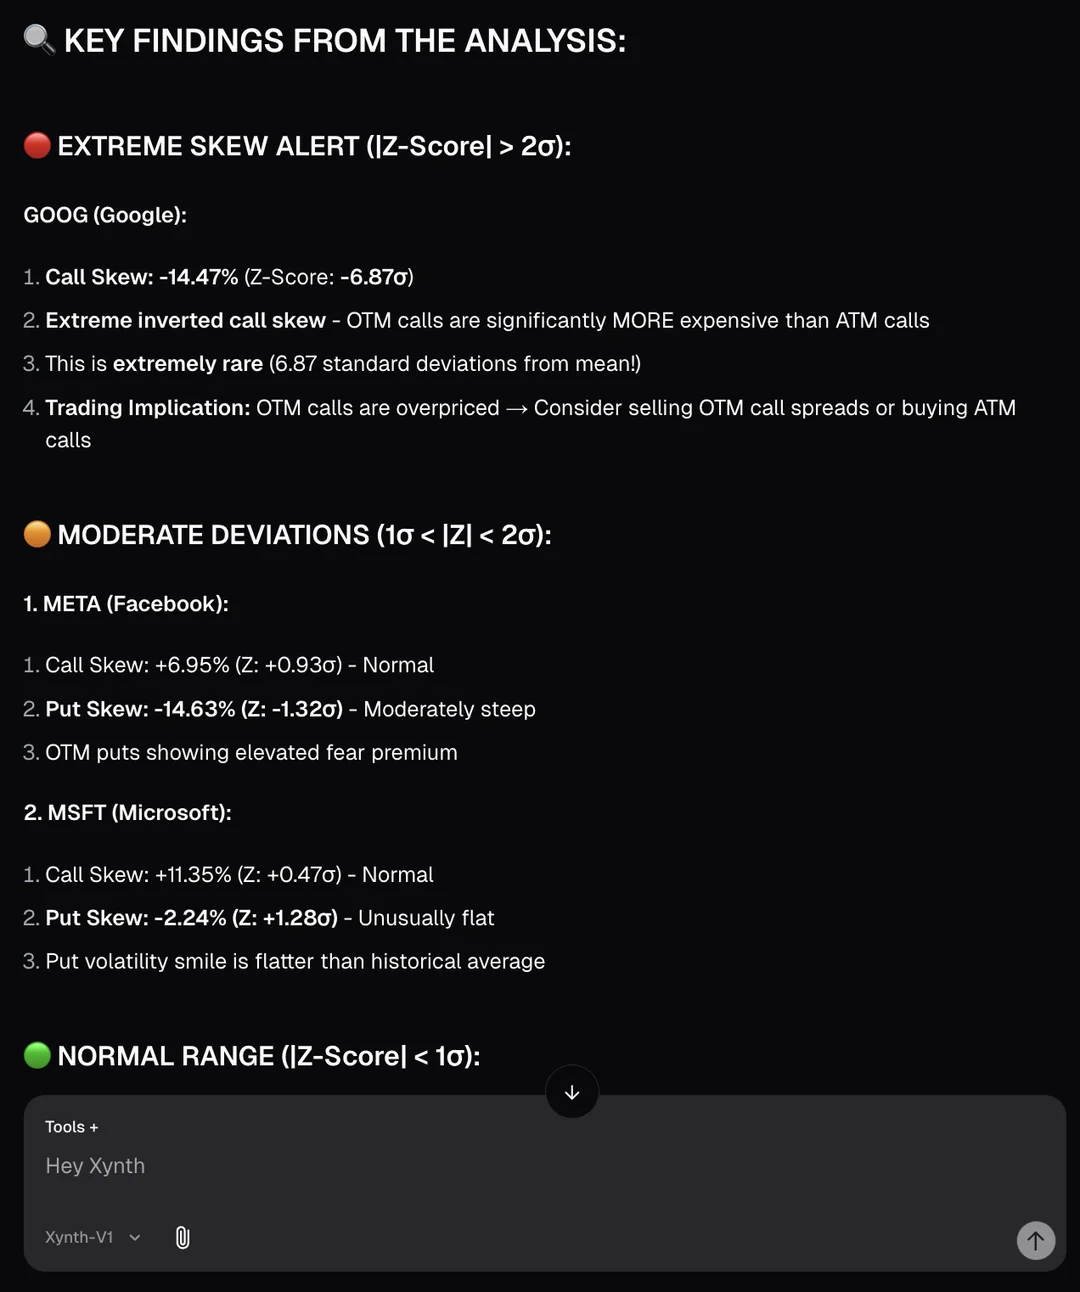
Before prompting AI, you must ensure it has access to real-time, current market data. You can use AI with built-in market data like Xynth, or download data from TradingView or Polygon and upload the CSV file to ChatGPT or Claude. Both methods work.This compares the current skew to the stock’s historical average. A Z-score of -2.0 indicates that the skew is 2 standard deviations higher than normal, which is statistically rare and more likely to revert. In short: How much is the current pricing deviating from the historical average?
IV/RV Mismatch
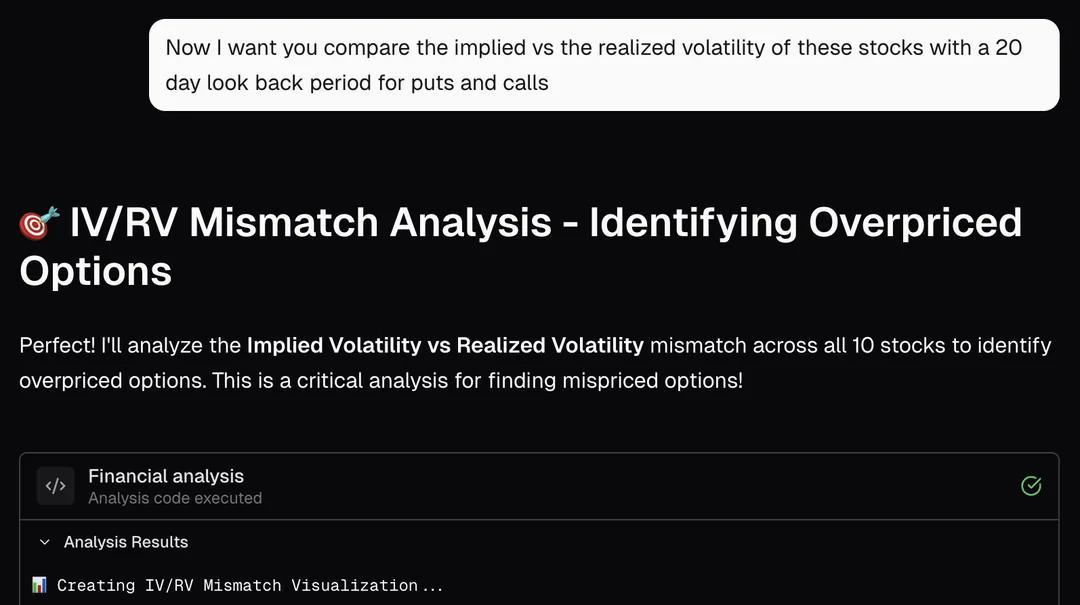
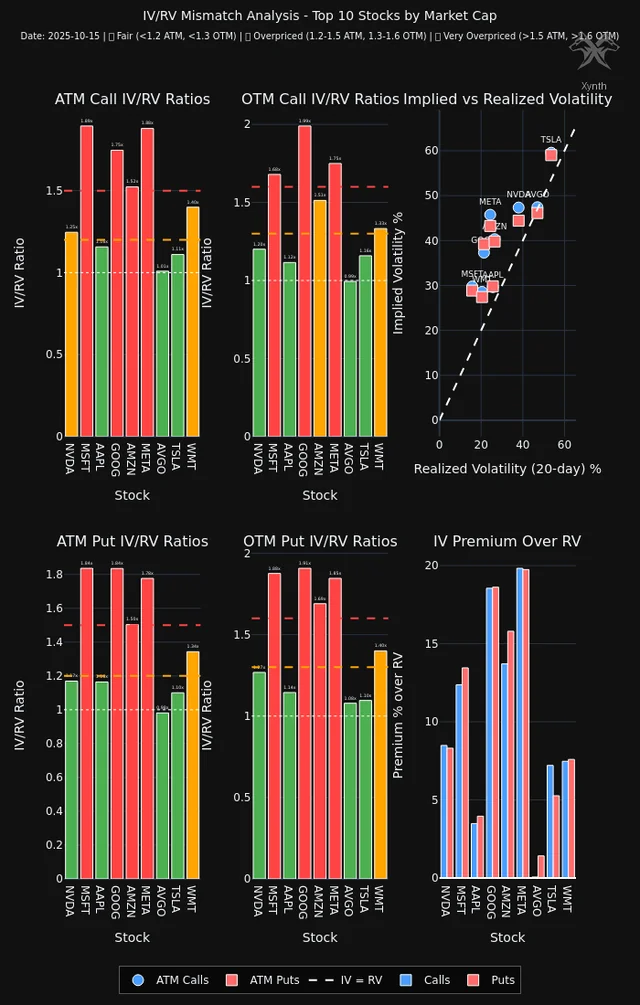
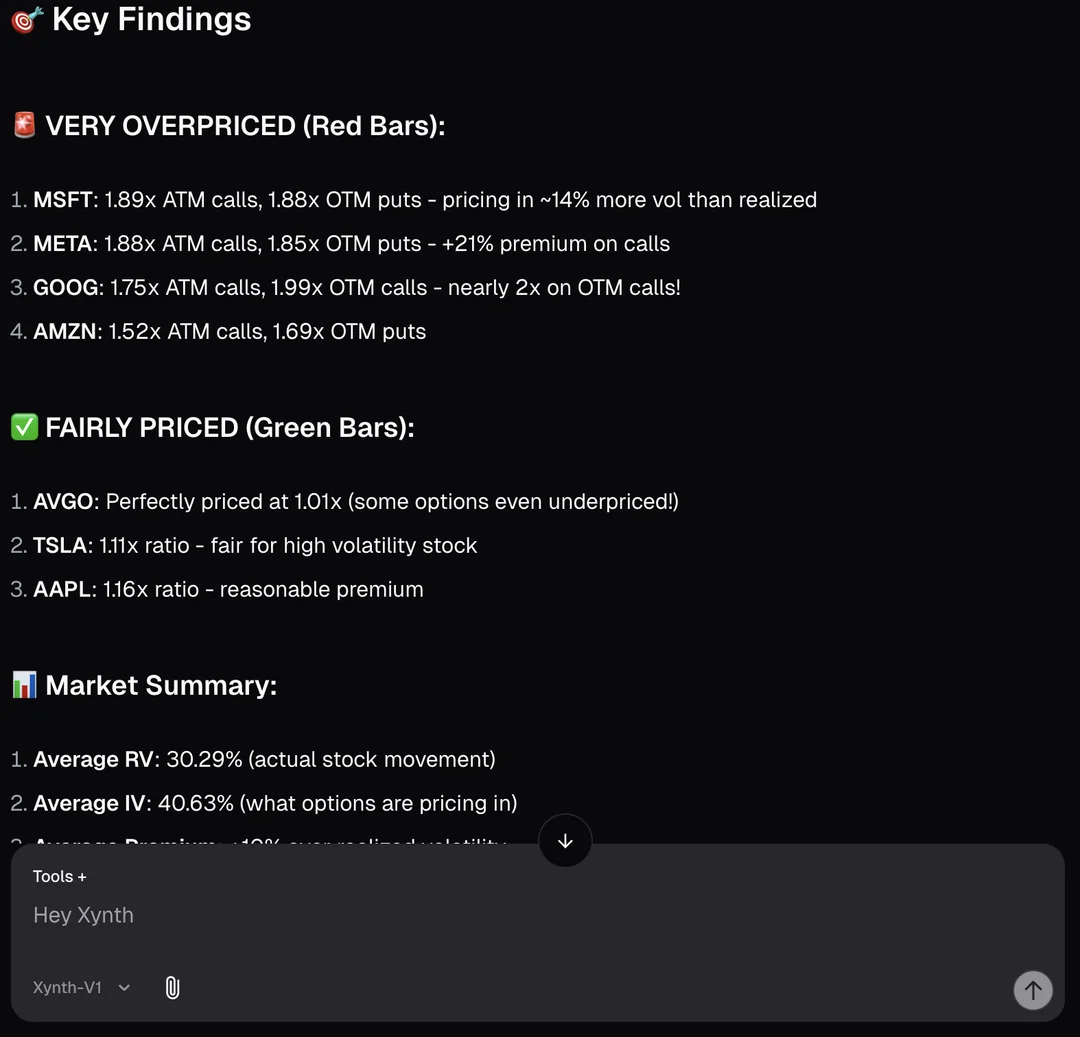
Compare current IV with RV (Realized Volatility), which represents the market’s expectation of the stock’s movement versus its recent actual performance:
- OTM Strikes: Implied Volatility (IV) should be significantly higher than Realized Volatility → Overpriced
- ATM Strikes: IV should be equal to or lower than Realized Volatility → Fairly priced
When both conditions occur, you face an expensive option and a cheap one. This is your spread.
Momentum Confirmation
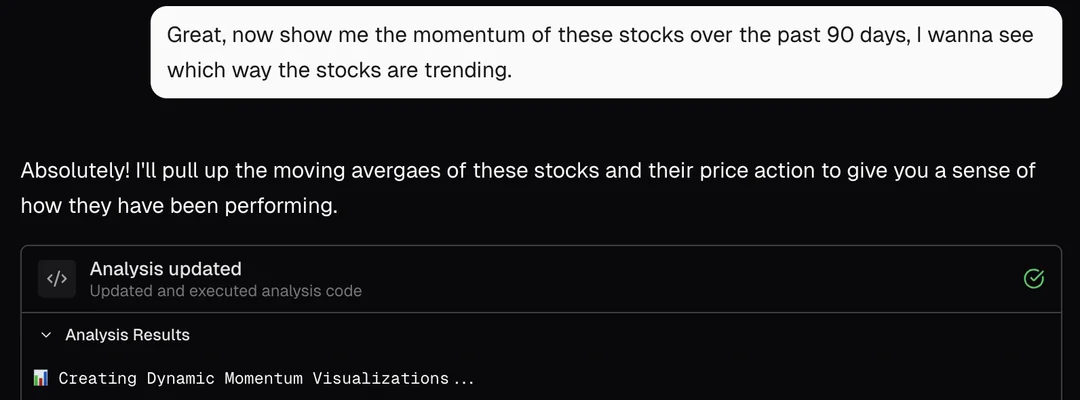
This tells you the direction of the trade:
- Positive Momentum + Call Skew → Buy Call Spread (Buy ATM Call, Sell OTM Call)
- Negative Momentum + Put Skew → Buy Put Spread (Buy ATM Put, Sell OTM Put)
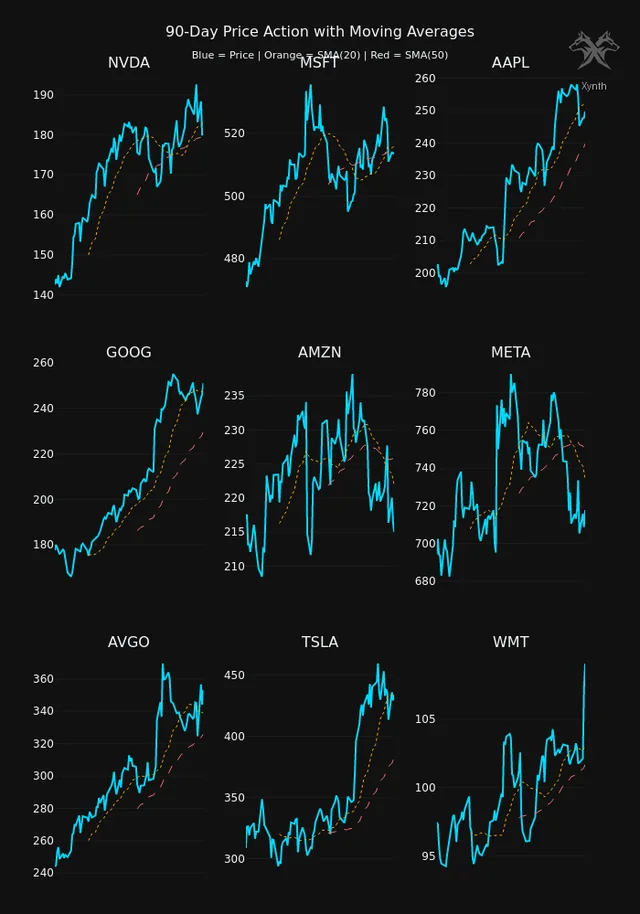
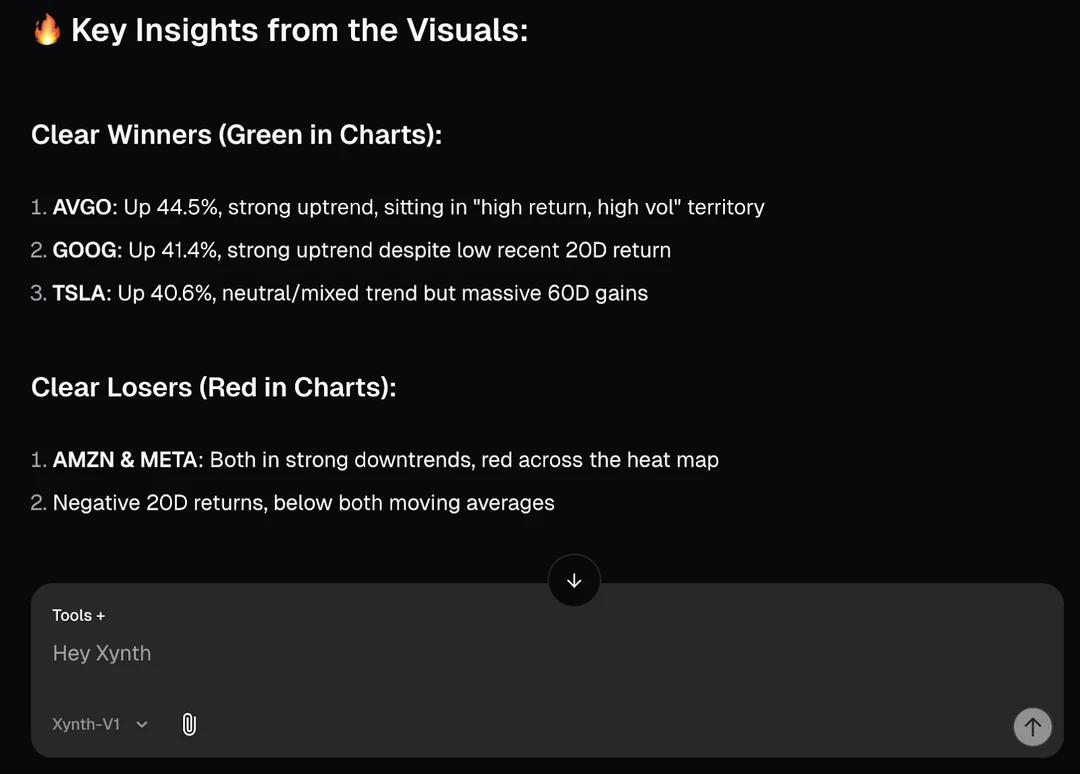
Trading: Vertical Spreads
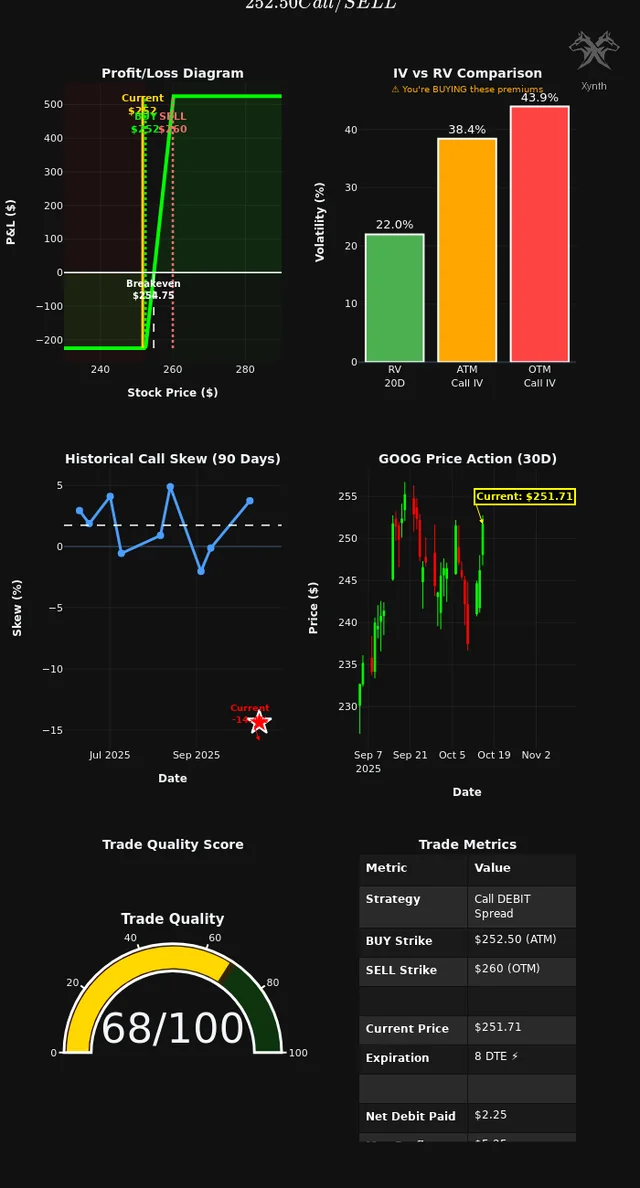
Once you identify significant skew, this is how you structure the trade. I primarily trade bull spreads because I dislike shorting, but you can assume the reverse approach is also viable:
- Buy ATM Option (Fairly priced, ~50 delta)
- Sell OTM Option (Overpriced, ~10-25 delta)
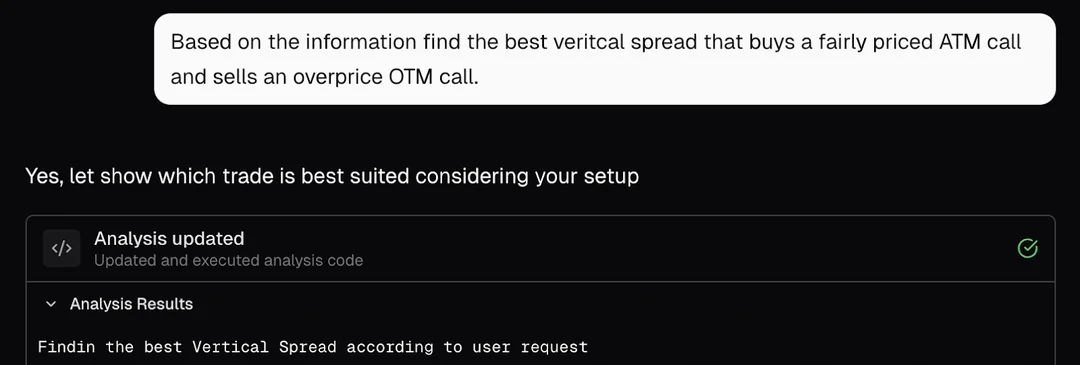
attention
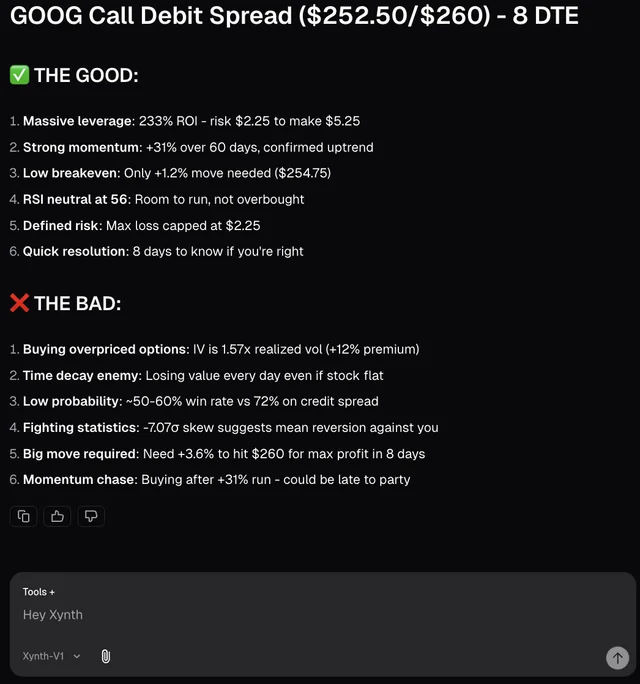
These images are examples from my Xynth chat. In this specific trade, the score was only 68/100, primarily because the ATM option was already overpriced, limiting the spread’s profit potential. However, the concept remains valid. Feel free to adjust the variables in the prompt and expand the scan range, running this scanner on more stocks daily or even hourly.If you’ve read this far, you likely realize the focus of this strategy is not purely directional. It is a play on relative value—a fancy way of saying you buy cheap things and sell expensive things simultaneously.
You are not just betting on the stock price going up or down; you are betting that the pricing relationship between the two options is distorted and will eventually normalize.
Furthermore, if the stock price experiences sharp volatility, your long option provides protection. You avoid unlimited risk on either side.
Results
I have been running this strategy for about 2 months, so take these numbers with a grain of salt; it is still too early.
Current Statistics:
- Win rate: ~38%
- Average return per winning trade: ~250%
- Average loss per losing trade: ~60%
- Net Value: Despite more losers than winners, the overall curve is upward
The essence of this strategy is asymmetry. I have some trades that gained 300-400% in a few weeks, and others that lost 50-70% just as quickly. But if you win 4 out of 10 trades with 3-4x returns, it easily covers the 6 losses.
For more quantitative trading concepts such as skew, refer to the systematic explanations in Quantitative Trading: 24 Lessons.