
Left-Digit Effect: Round Numbers and Price Refraction
People often ask where new factors and strategies come from. Today's note may spark some ideas.
Since 1932, researchers have noticed that prices ending in 9 — say, $3.99 — feel far smaller to consumers than the nearby round price of $4.00. This later became known as the left-digit effect. A similar phenomenon exists in securities trading, where it shows up as round-number pressure.
The Left-Digit Effect
Economists and psychologists have debated ever since whether the left-digit effect is real, and how to explain and exploit it.
The most recent study I've seen is from February 2023, when John A. List — from the renowned Department of Economics at the University of Chicago — and co-authors studied Lyft's pricing system (Left-Digit Bias at Lyft), arguing that exploiting left-digit bias in pricing could add about $160 million in annual profit.
In 2005, Cornell's Manoj Thomas and NYU's Vicki Morwitz published Penny Wise and Pound Foolish: The Left-Digit Effect in Price Cognition in the Journal of Consumer Research. Cited more than 300 times, it is one of the most influential papers in this field, modeling the phenomenon, confirming that it exists, and explaining the cognition behind it.
Round Numbers in Trading
We care more about how this effect — and its side effects — show up in securities trading.
Back in 1991, USC's Lawrence Harris studied a similar phenomenon in trading (Stock Price Clustering and Discreteness), but from the angle of clustering and discreteness in transaction prices.
His conclusion was that stock prices cluster on integer fractions. As price levels and volatility increase, the number of clusters grows. At the time, however, the minimum tick in US stocks was 1/8 of a dollar. From January 29, 2001, the NYSE dropped the old 1/8 and 1/16 fractions and moved fully to decimals. Research on price clustering therefore deserves a fresh look today.
Pricing in trading works differently than in retail. Retailers fully exploit the left-digit effect to make shoppers feel they got a bargain. Securities pricing is more like real estate — one price for one asset — where price comes out of negotiation between two sides.
Both sides in a negotiation are on roughly equal footing, and for cognitive reasons both gravitate toward round numbers. For example, pricing a house at 5 million is natural, and 5.1 million is also fine, but asking 5.132 million only invites haggling over meaningless precision and makes a deal harder to close.
info
Conversely, if you want to grab attention, avoid round numbers — that makes a number feel more meaningful, even when it isn't. Jack Ma often uses this example: we want to build a company that lives for 101 years. Why 101 and not 100? Because only then do people realize this isn't a number tossed off casually, but a carefully considered one — which in fact anchors on 100 years. Say "a 100-year company" and people just hear "a company that lives a long time."In China A-shares, indexes have some famous round-number levels, such as 3,000. People joke about the market's perennial 3,000, even though the actual center of fluctuation might be 31xx or 29xx.
Around that level, every 100 points forms a major support/resistance zone. If other technical indicators confirm at the same node, that support/resistance is more likely to hold. Once confirmed, the subsequent trend tends to be larger and longer-lasting.
For single stocks under 20 yuan, every whole-yuan price is an obvious round-number barrier; for some low-priced stocks, every 0.1-yuan level acts as one. For 100-yuan stocks, it may take a 10-yuan increment to form a meaningful barrier. This still needs more empirical work.
Predicting Moves After Round Numbers with Light Refraction
This comes from a recent paper I read that applies the physics of light refraction to price behavior at round numbers — a bold leap. But research does require an open mind; that is how you get unexpected results.
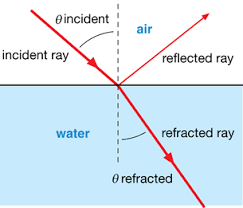
First, recall how light behaves when traveling through two materials of different density. When light hits the boundary between two media, part of it reflects and part of it refracts.
At a suitable angle of incidence, light passes through the medium and refracts — analogous to price breaking out of a zone and continuing at a different angle. Or total reflection can occur — analogous to price failing to cross the zone and bouncing back.
info
Similar dynamics occur beyond just round numbers. More generally, once price successfully breaks above a high-volume zone, overhead resistance thins out — like moving from dense water into thin air — and the rally can accelerate.Take Ubisoft as an example:
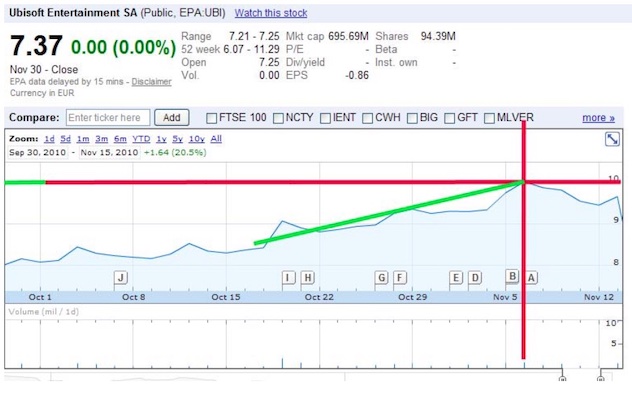
Ubisoft hit the round number of 10 on October 26. The parameters are defined as follows:
- When price equals the round number, that fixes the point of incidence.
- The incident ray is a linear regression on the 10 closes before the point of incidence.
- The angle between the incident ray and the normal is recorded as the angle of incidence.
- The refractive index $n_1$ of medium 1 (before the round number) is assumed to be 1.
- The refractive index $n_2$ of medium 2 (after the round number) is calculated as:
$$ n_2 = l x k x p $$
Where,
$$ l = \frac{NZC}{NZS} $$
NZC is the number of up days in the period, NZS is the number of down days. In the Ubisoft example, there were 62 up days and 79 down days, so l is 0.7848.
$$ K = \frac{VMT10}{VMTC} $$
Here VMT10 is the average volume over the last 10 days, and VMTC is the average volume on positive-return days over the period. In the Ubisoft example, this value is 0.6919.
$$ p = \frac{PM10}{VI} $$
Here PM10 is the average price over the last 10 days, and VI is the round-number price under analysis. For example, if the round number is 10 and the average price after crossing it is 9.3, then p is 0.93.
The resulting $n_2$ is 0.5104, far below the pre-crossing index. If the angle of incidence is below the critical angle, total reflection will occur — price drops immediately after hitting the round number — the sharp plunge traders often call an "A-shaped" sell-off.
The angle of refraction is calculated as:
$$ r = sin^{-1}(\frac{1}{n_2}sin_i) $$
In the example, $n_2$ is 0.5104 and the angle of incidence is 82.5, so the refraction term is 1.43. Since this value exceeds 1, total reflection occurs — i.e., price falls.
The critical angle is calculated as:
$$ i_{critic} = sin^{-1}(\frac{n_2}{n_1}) $$
If the angle of incidence is below the critical angle, price will cross the round number, but gains will be smaller than in the prior ten days. If it equals the critical angle, price will consolidate at the round number!
The paper's idea is novel, but it makes sense. We often see that after a sustained rally, technical indicators like RSI need to cool off (behind every indicator stands a cohort of capital that believes in it), and the question is whether the rally can continue. I have been thinking about this too.
From a trading perspective, a sharp pullback is usually not a good sign — the equivalent of total reflection here. But if the pullback is slow and consolidation lasts long enough, and the broader market holds up, continuation seems more likely — though we lack a basis for predicting up versus down. This method computes the refractive index of the current medium to predict direction, and it is a direction worth exploring further.
The paper is titled Measuring the Pressure of Prices-Integer Values, Over the Stock Trend, by Mihail Dumitru Sacala of the Bucharest Academy of Economic Studies. The version I have appears in the proceedings of the First International Conference on Financial and Monetary Stability in Emerging Countries — an 876-page volume, with this article on page 322.
The original uses some physics that I am a bit rusty on, so my interpretation may not be fully accurate — interested readers should check the paper itself. It is no coincidence that so many quants come from physics backgrounds.