
Regret-Aversion Factor Hits 5.5 Sharpe in A-Shares
If a stock drops right after you buy it, would you rush to sell the next day? Conversely, if it rallies right after you sell, would you chase it back?
Hold that thought — let's see what the research says. These questions fall squarely in the domain of behavioral finance, and this particular case can be explained by regret theory. Also known as Fear of Regret Theory, it is a cornerstone of behavioral finance: irrational investors tend to avoid regret, seek pride, and refuse to admit past mistakes when making decisions.
TAKEAWAY
1. Regret-aversion theory is a cornerstone of behavioral finance 2. Intraday floating losses trigger reluctance to sell, a classic regret-aversion case 3. Use order sequence numbers to sign trade directionSo when some influencers say "only make money within your circle of competence" and "once sold, I don't care if it moons," it may be sound discipline — or it may just be self-justification.
So can we turn behavioral finance into quantifiable factors for factor mining? A recent report from Sinolink Securities analyst Zhiwei Gao does exactly that, and we break it down here.
Gao hypothesizes that
(Author's note: you can cross-check this with Eastmoney Guba data — how many die-hard fans vs. newcomers a stock has. If loyal holders dominate and there is no fresh buying interest after a sell-off, the stock may face a short-term buy-side vacuum. With more newcomers, this may not hold.)
Based on this hypothesis, he constructs the following four factors:
To sign trade direction, he uses a neat trick:
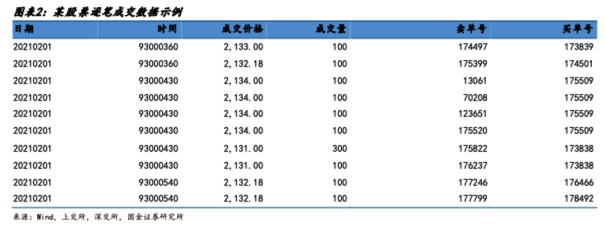
In the chart above, take the first trade as an example: the buy order ID comes first and the sell order ID comes later, meaning the buyer posted first and the seller hit the bid — so it is classified as an active sell. The same logic applies to the rest.
Backtesting on the CSI 1000 universe from 2016 to 2022 gives the following metrics:
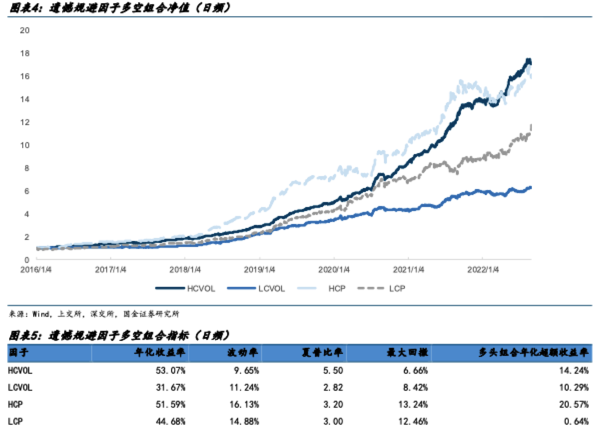
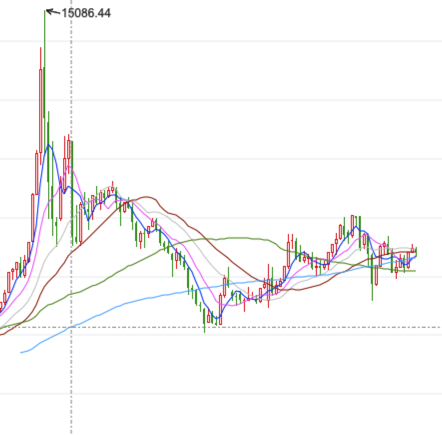
For reference, here is the monthly chart of the CSI 1000 since January 2016 (the vertical dashed line marks January 2016):
The numbers look impressive — especially HCVOL, with a Sharpe ratio as high as 5.5, in a league of its own.
But does the premise hold? Note that
Quantitative trading accounts for less than 30% of turnover in China A-shares, so most market participants are still irrational (as opposed to trading on systematic, emotion-free models); and the regulator recently criticized funds for trading like retail investors. In other words, irrational investors remain widespread in A-shares, so the theory is indeed applicable.
In addition, Gao uses intraday data, taking the intraday VWAP as investors' anchored cost to estimate the share of capital sitting in floating losses.
Others use daily or weekly bars combined with turnover to estimate anchored costs — for example, in the