
Z-Score Factor: Signals, Limits, and Mean Reversion
The January 2024 issue of Technical Analysis of Stocks & Commodities features Z-score as its fourth article, titled Z-score: How to use it in Trading. We'll take this opportunity to share our own views on building quant factors with Z-score.
Technical Analysis of Stocks & Commodities
Founded in 1982 by Jack Huston, a Boeing mechanical engineer, Technical Analysis of Stocks & Commodities covers global industry trends, leading figures, trading techniques, managed funds, and both fundamental and technical analysis. With over one million subscribers, it is now essential reading for quantitative traders.As an aside, early masters of technical analysis were often trained as mechanical engineers — Welles Wilder, inventor of classic indicators such as RSI, ATR and SAR, was also a mechanical engineer. In the future, great traders may well come from software.
Calculating the Z-Score
The Z-score is calculated as: $$ Z = \frac{X-\mu}{\sigma} $$
Here $Z$ is the z-score, $X$ is typically the price, $\mu$ is the mean, and $\sigma$ is the standard deviation, also known as volatility.
If X follows a normal distribution, then:
- The probability of abs(z-score) >= 2 is less than 2.3%
- The probability of abs(z-score) >= 3 is less than 0.13%
This can be used as a kind of reversal signal: once the z-score moves beyond ±2, there is a 97.7% chance it will revert back inside ±2 — in other words, the price should revert toward the mean.
The scipy.stats package offers a zscore function, but it is computed over the full sample you pass in. For factor construction we need a rolling z-score. So we compute it ourselves with pandas rolling:
def rolling_zscore(s, win=20):
ma = s.rolling(window=win).mean()
std = s.rolling(window=win).std()
return (s - ma)/stdnumpy vs pandas
numpy has no rolling method. It offers an as_strides method in np.lib.stride_tricks to generate sliding-window views, but for performance reasons numpy discourages its use. In pandas, rolling has Cython and Numba implementations and is much faster.This round goes to pandas.
We won't run the full pipeline in this note. Instead, we'll pick a random ticker, compute its z-score over the last 250 bars, mark z-scores below -2 as buys and above +2 as sells, plot them, and dig deeper into what the chart tells us:
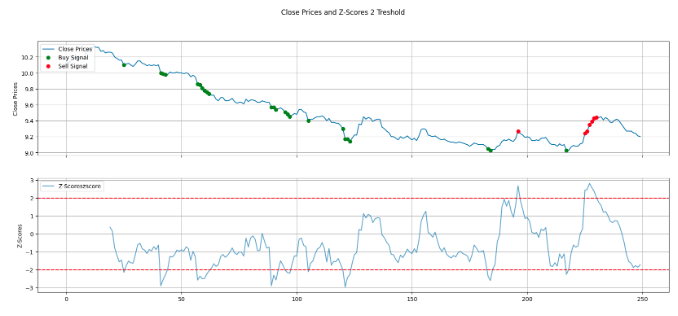
Almost every buy sits near a local low, and almost every sell sits near a local high. But in a downtrend, even buying the exact low doesn't help much — the bounce is short-lived and shallow, and price often turns down again long before a z-score sell signal appears.
In other words, a z-score above 2 is sufficient but not necessary for a sell; a z-score below -2 is sufficient but not necessary for a buy. It does not forecast the future trend, and 97.7% of the time it emits no trading signal at all, leaving capital underutilized. Therefore, a z-score can make a factor, but not a strategy. As a factor, however, it is excellent because its signals are well-defined and have a very high win rate.
Relationship with Bollinger Bands
If you know Bollinger Bands, you'll see the Z-score uses exactly the same math. The difference is that Bollinger Bands plot upper and lower bands at ±2 standard deviations from the mean, whose absolute levels can swing widely, while the z-score itself lives in a fixed range around (-3, +3), which acts like normalization. That makes it easy to use as a factor in machine learning. For true normalization, just take the cumulative probability of the z-score — it is distributed over [0,1], with a value of 0.977 when the z-score equals 2.
Bollinger Bands
Bollinger Bands were all the rage in the 1980s. The name is even a registered trademark — in English we still have to write it as Bollinger Bands®. Why did Bollinger Bands mint money back then but work far less well today? That is really a behavioral finance story. When the indicator first appeared, its irrefutable statistical logic won over so many traders that belief itself changed trading behavior, trapping everyone in a self-fulfilling prophecy.More importantly, out at two standard deviations, the event is rare but can be severe when it does happen. That is the black swan effect described by Taleb. In China A-shares, the rule is simple: if a ±2-sigma deviation comes with a price limit lock-up, drop the Z-score signal decisively. In that situation, sentiment is extreme.
Quiz
If price changes follow no normal — or no known — distribution, how should we capture their statistical properties?
For example: if the Shanghai Composite (沪指) is down 4% today, what is the probability it keeps falling, based on the past 1,000 trading days? How would you answer? Anyone who can answer this correctly can catch washout bottoms — or fade panic sell-offs triggered by surprise events.
Hint: this is the question we use in our course to introduce PDF/CDF concepts.
KEY TAKEAWAY
1. Like Bollinger Bands, the Z-score builds on normal-distribution logic, using the mean-standard deviation relationship to flag "unreasonable" moves and bet on mean reversion. 2. The Z-score lives roughly in (-3,3), with moves beyond ±2 occurring only 2.3% of the time. 3. The math is elegant, but stock-price moves are not normally distributed, so the foundation is fragile. Much of modern finance runs on conditions that cannot be met — which is why Charlie Munger liked to mock economists.