Pandas Tricks: Monthly Alignment and Top-N Selection
In quant research, Pandas is an indispensable tool — its powerful data processing and analysis capabilities greatly simplify data workflows.
Today we'll cover two tricks, both related to factor testing. The first is aligning dates by month; the second is how to extract the top N records from each group. The concepts involved include group operations, index frequency, and working with a MultiIndex (accessing and dropping levels).
In the final example, we use groupby repeatedly to complete a slightly more complex data operation with concise syntax.
Aligning Dates by Month
When running factor testing at frequencies lower than daily, depending on your data source, you can run into an issue like this: say the market close for January this year is January 31, but a stock is suspended that day, so the monthly bar from your vendor may be stamped January 30. In other words, when you build monthly factor data, some stocks are dated January 31, while others are dated January 30 or even earlier.
If you use Alphalens for factor testing, these misaligned dates will break forward-return calculations. That's not what we're focusing on today, though. We'll jump straight to the fix — how to snap every stock's factor date to the same month.
Suppose we have the following data:
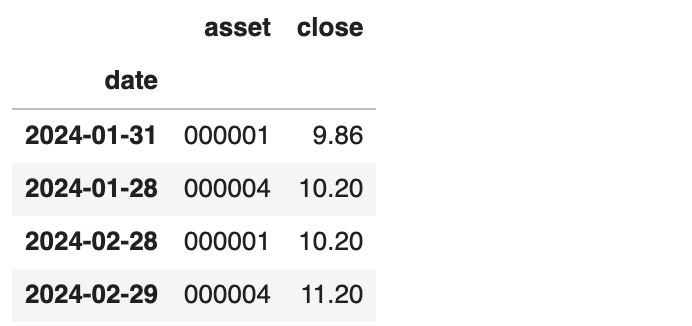
Here, the closing dates for the two stocks don't match in either January or February. The simplest fix is to use the index.to_period function to snap dates to the month.
df.index = df.index.to_period(freq='M')After the conversion, you get the following result:
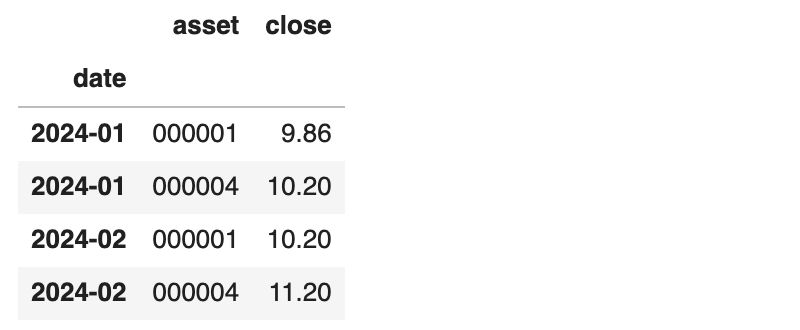
This conversion achieves alignment, but it loses the specific date information. We can achieve the same thing with groupby:
(df
.groupby(['asset', pd.Grouper(freq='M')])
.last()
.reset_index("asset")The result is:
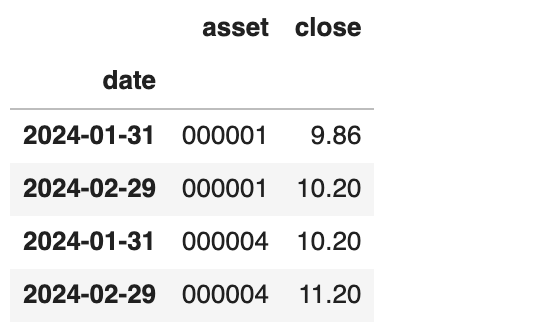
The key syntax point is that asset plus the index form an effectively unique index. We now want to adjust the index dates, grouping by 'asset' and specifying the grouping frequency via Grouper. Grouper operates on the index.
.last() controls how a record is picked from each group. It's an aggregation function — others include first, min, max, mean, and so on. In our example, since asset plus the index form a unique index, first, last, min, or max all return the same result.
Extracting the Top N Rows per Group
Suppose we've confirmed through factor testing that a factor works and want to validate it on a test dataset. The test dataset also spans many periods. For each period, we need to take the top 20% of stocks, then compute their returns over subsequent periods T1~Tn to decide whether the factor is ready to use.
This is essentially a group-the-DataFrame, then take-the-top-N-rows problem.
Suppose the data looks like this:
df = pd.DataFrame(
[
(datetime.datetime(2024, 1, 31), "000001", 9.86),
(datetime.datetime(2024, 1, 31), "000002", 10.2),
(datetime.datetime(2024, 1, 31), "000003", 9.84),
(datetime.datetime(2024, 1, 31), "000004", 11.2),
(datetime.datetime(2024, 2, 29), "000001", 10.2),
(datetime.datetime(2024, 2, 29), "000002", 11.2),
(datetime.datetime(2024, 2, 29), "000003", 9.83),
(datetime.datetime(2024, 2, 29), "000004", 11),
],
columns=["date", "asset", "factor"]
)We want the top N by factor for each month, and to build a dict whose keys are monthly dates and whose values are the corresponding asset arrays.
top_n_assets = (df
.groupby(level=0)
.apply(lambda x: x.nlargest(2, 'factor')['asset'])
.reset_index(level = 1, drop = True)
.groupby(level=0)
.apply(list)
).todict()
top_n_assetsThe output is:
date
2024-01-31 [000004, 000002]
2024-02-29 [000002, 000004]
Name: asset, dtype: object
The trick here is that when you want to group by the index, you use the grouby(level=?) syntax. Pandas supports a MultiIndex — the first level is generally referenced with level=0, the second with level=1.
After grouping with groupby, the resulting DataFrame has two index levels. That intermediate result looks like this:
date date
2024-01-31 2024-01-31 000004
2024-01-31 000002
2024-02-29 2024-02-29 000002
2024-02-29 000004
Name: asset, dtype: objectWe drop the second level via reset_index on line 4. Note that in Pandas, dropping an index is also done by calling reset_index. At this point, we've already completed the task of extracting the top N rows per group.
Lines 5-6 flatten the extracted result — that is, they compress the assets laid out across multiple rows into a single list. The result is still a DataFrame, but each date now has only one row, containing that period's top N assets.
Both tips introduced today come up all the time in factor testing. Master these Pandas techniques and you can power through factor testing and iterate much faster on factor research. Got it?