
Mastering Pandas MultiIndex for Quant Factor Analysis
Cover image: Princeton University. Princeton University holds significant research strength in quantitative finance and counts renowned scholars such as Mark Brunnermeier and Professor Jianqing Fan (a Chinese-American statistician, Princeton Finance Professor, and Dean of the School of Data Science at Fudan University) among its faculty.
Pandas’ MultiIndex (also known as hierarchical indexing) is a powerful feature. When conducting factor analysis or portfolio management, MultiIndex is often encountered and sometimes indispensable. For instance, when performing factor analysis with Alphalens, the required input data format is indexed by both date and asset. The same data structure is used in backtests. For example, if the universe in our backtest consists of multiple assets and we need to pass market data to the strategy, we can do so via a dictionary or, as discussed here, via a MultiIndex DataFrame.
In this article, we will cover the create, read, update, and delete (CRUD) operations for MultiIndex.
Creating a DataFrame with MultiIndex
Let’s start with a standard market data dataset.
import pandas as pd
import numpy as np
dates = pd.date_range('2023-01-01', '2023-01-05').repeat(2)
df = pd.DataFrame(
{
"date": dates,
"asset": ["000001", "000002"] * 5,
"close": (1 + np.random.normal(0, scale=0.03, size=10)).cumprod() * 10,
"open": (1 + np.random.normal(0, scale=0.03, size=10)).cumprod() * 10,
"high": (1 + np.random.normal(0, scale=0.03, size=10)).cumprod() * 10,
"low": (1 + np.random.normal(0, scale=0.03, size=10)).cumprod() * 10
}
)
df.tail()The resulting dataset is as follows:
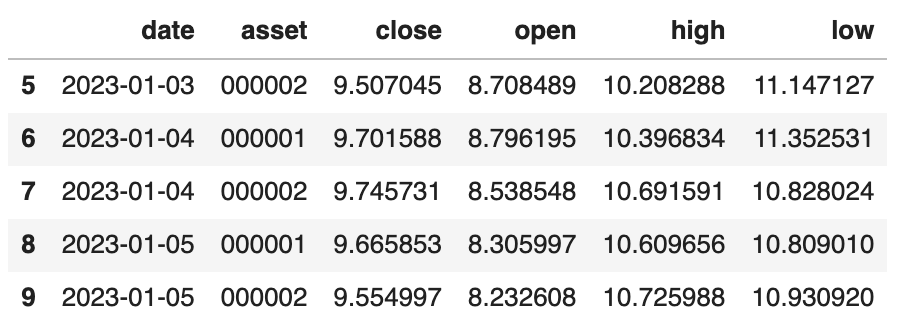
We can set the index to date using the set_index method:
df1 = df.set_index('date')
df1This yields a DataFrame with only the date index.
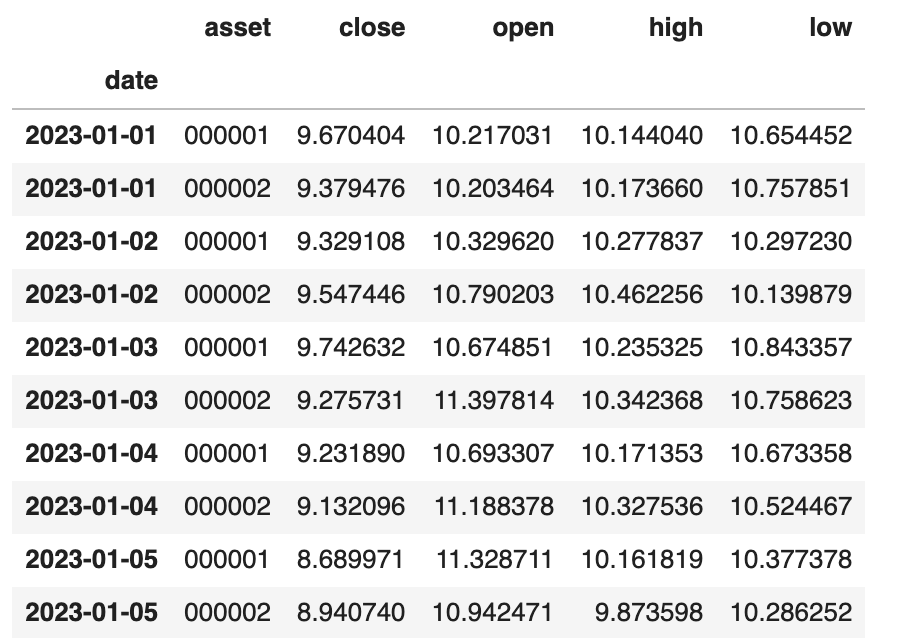
If we pass an array to set_index, we obtain a MultiIndex:
df.set_index(['date', 'asset'])This generates a DataFrame with a two-level index.
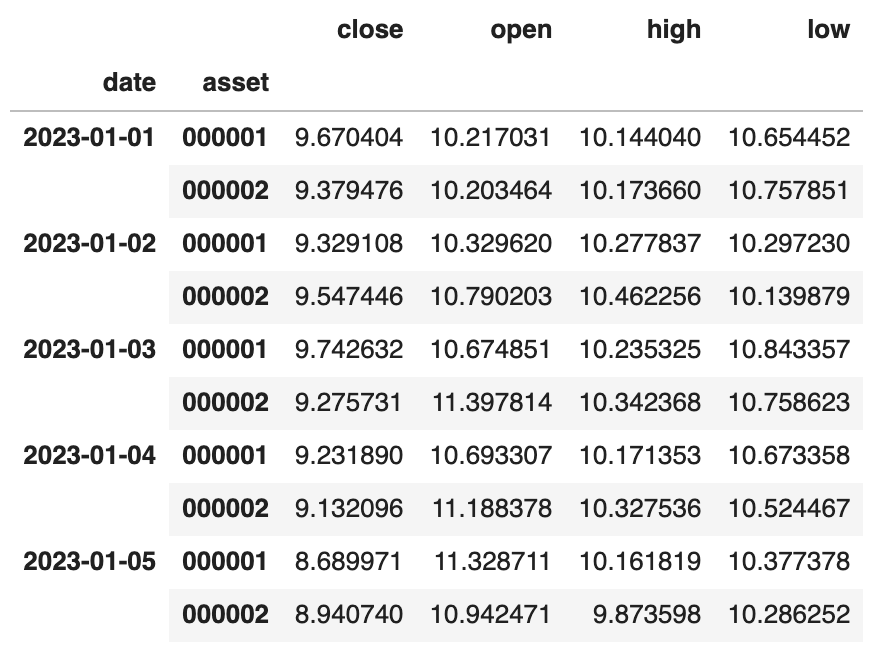
The set_index syntax is highly flexible; it can set a completely new index (discarding the previous one) or add columns as indices:
df1.set_index('asset', append=True)The result is identical to the image above. However, if you find the index order incorrect—for example, if you want asset to precede date—you can proceed as follows:
df2 = df1.set_index('asset', append=True)
df2.swaplevel(0, 1)We used the swaplevel method to exchange the index order. However, if our index fields exceed two, we must use the reorder_levels() method.
Renaming Indices
When data is passed between different Python libraries, it is often necessary to change the data format (column names, indices, etc.) to adapt to different libraries. To rename indices, we can use one of the following methods:
from IPython.core.interactiveshell import InteractiveShell
InteractiveShell.ast_node_interactivity = "all"
df2.rename_axis(index={"date": "new_date"}) # Using a dict, partial args allowed
df2.rename_axis(["asset", "date"]) # Using a list, one-to-one correspondence
_ = df.index.rename('ord', inplace=True) # Single index
df
_ = df2.index.rename(["new_date", "new_asset"], inplace=True)
df2In contrast, we often use df.rename to rename columns. While this method also has an option to rename indices, the semantics are significantly different:
df.rename(index={"date": "rename_date"}) # No effectNothing happens. What is going on? Why did it fail to rename the index? This actually involves a deep mechanism in DataFrame: Axes and axis.
Axes and Axis
You may rarely encounter this concept, but you can verify it yourself:
df = pd.DataFrame([(0, 1, 2), (2, 3, 4)], columns=list("ABC"))
df.axesWe see the following output:
[
RangeIndex(start=0, stop=2, step=1),
Index(['A', 'B', 'C'], dtype='object')
]Both elements are referred to as Axis. The first is the row index, which we might reference using axis = 0 or axis = 'index' when calling Pandas functions; the second is the column index, which we might reference using axis = 1 or axis = 'columns'.
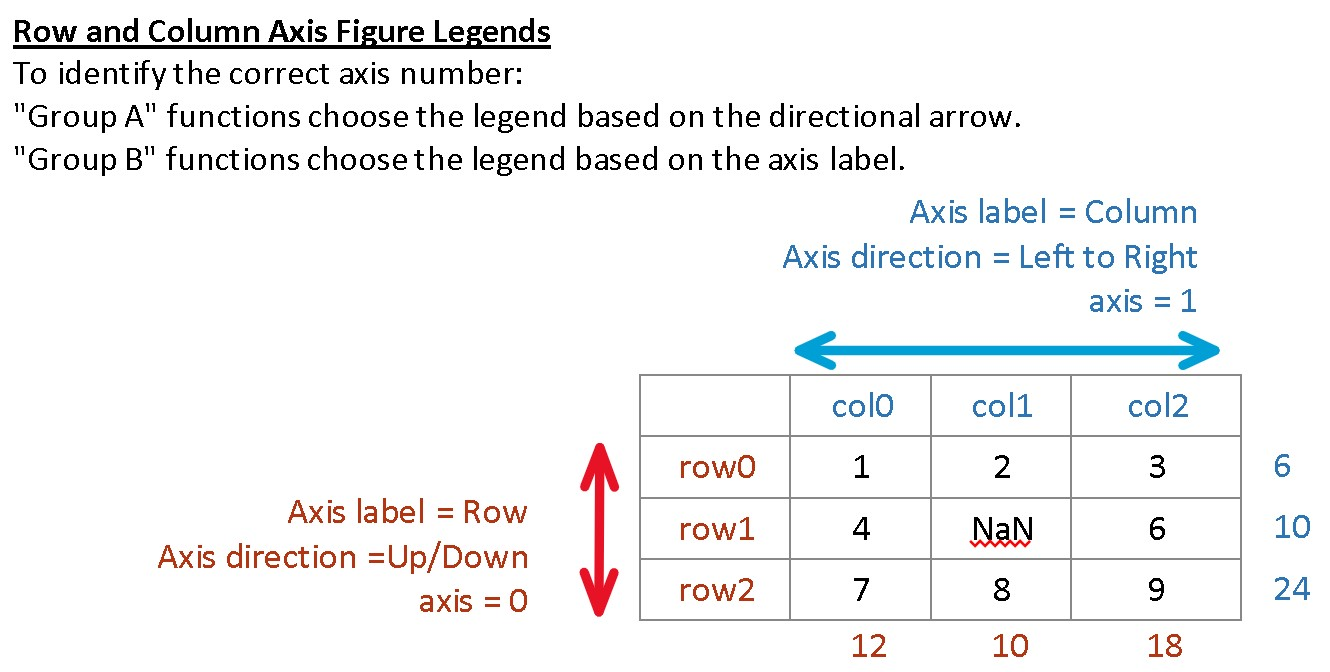
So far, both indices have only one level (level=0) and no names. When we refer to Column A, Column B, and rename them, we are actually modifying the values of certain elements within axis=1.
Now, we should understand that when we call df.rename({"date": "rename_date"}), the target is not axis = 0 itself, but rather the elements within axis=0. However, since there is no element named "date" in the index (the indices in df are of date type), this renaming operation fails.
Now we understand why we can use df.index.rename to rename indices. Similarly, we can guess that df.columns.rename can be used to rename columns.
df = pd.DataFrame([(0, 1, 2), (2, 3, 4)], columns=list("ABC"))
df.columns.rename("Fantastic Columns", inplace=True)
df.index.rename("Fantastic Rows", inplace=True)
dfThe displayed DataFrame will now show names for the row index and column index in the top-left corner.
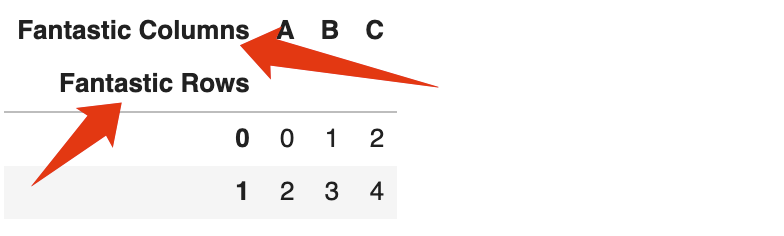
Similarly, we can infer that if rows have MultiIndex, columns can also have MultiIndex.
import pandas as pd
import numpy as np
# Create multi-level column index
columns = pd.MultiIndex.from_tuples([
('stock', 'price'),
('stock', 'volume'),
('bond', 'price'),
('bond', 'volume')
])
data = np.random.rand(5, 4)
df = pd.DataFrame(data, columns=columns)
df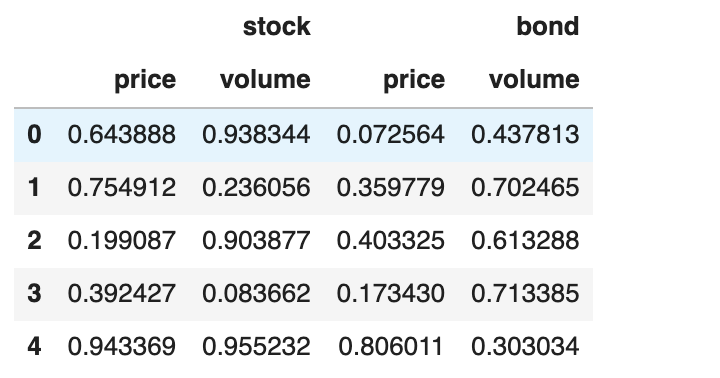
The top-left corner is blank, meaning neither the row index nor the column index of this DataFrame has been named (which seems counter-intuitive at first glance; aren't the column indices stock and bond?).
In summary, if we want to name the row or column index, please use the "formal" method, i.e., rename_axis. We took a long detour to explain why rename_axis should be the formal method for renaming row and column indices.
The following example shows how to rename the column index of a MultiIndex DataFrame:
df.rename_axis(["type", "column"], axis=1)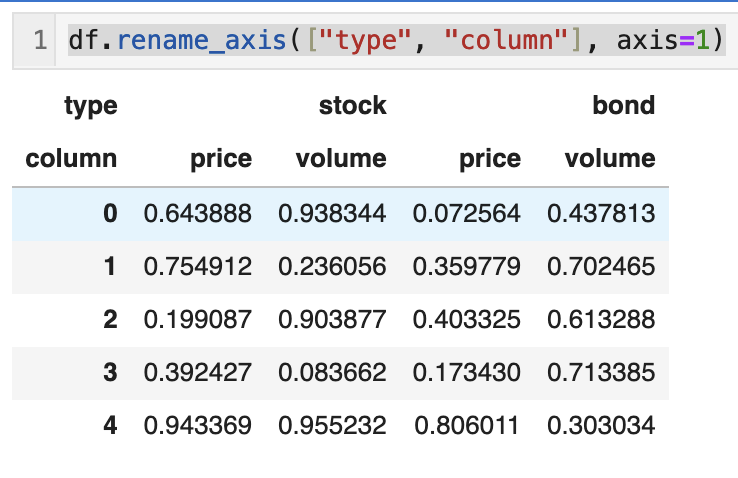
This looks very similar to merged header cells in an Excel worksheet.
Accessing Index Values
Sometimes we need to view the values of the index, perhaps for troubleshooting or to pass to other modules. For example, in factor testing, we might specifically want to know which asset performed best on a specific day, and this asset value resides in the MultiIndex.
If there is only a single-level index, we use index or columns to reference their values. What if it is a MultiIndex? Pandas introduces the concept of level. Let’s take df2 as an example. It should be a DataFrame indexed by new_date and new_asset.
Here, new_date is the row index at level=0, and new_asset is the row index at level=1. To retrieve the values of these indices, we can use the df.index.get_level_values method:
df2.index.get_level_values(0)
df2.index.get_level_values(level=1)
df2.index.get_level_values(level='new_asset')When the index is unnamed, we must use integers to index it. Otherwise, we can use its name to index it, as shown in the third line.
Retrieving Records by Index
When a MultiIndex exists, retrieving all records where the index equals a specific value is straightforward using the xs function. Let’s return to df2, which is indexed by new_date and new_asset.
Now, we want to retrieve all market data for assets equal to 000001:
df2.xs('000001', level='asset')We obtain a DataFrame with a single-level index containing all records for 000001.