QuanTide Weekly: Hedge Funds Cut Positions, Flag Pattern Detection
This Week’s Headlines
- Huaxing Quant announces reduction of hedge product positions to 0
- September CPI, PPI, and Q1–Q3 GDP data released
- Pan Gongsheng speaks: Macroeconomic policy should prioritize consumption
Next Week’s Highlights
- Monday: Latest LPR quotes
- Tuesday: Huawei HarmonyOS Native Product Launch Event
- Friday: Adjustment of existing mortgage rates by multiple banks
- Sunday: Global Low-Altitude Economy Forum Annual Meeting
This Week’s Selection
- Serial: Numpy Programming Essentials for Quants (7)
- Huaxing Quant (Ningbo) announced it will gradually reduce the investment positions of all its hedge products to zero, while waiving management fees for these products starting October 28. The rationale is that changing market conditions make it difficult for hedge products to simultaneously generate returns and reduce risk exposure, leading to a significant decline in the risk-reward ratio. Future returns are expected to fall well below investor expectations. Investors are advised to adjust their portfolios appropriately; index-enhanced products are better suited for allocation during market lows. Provided risk tolerance matches, hedge products can be converted to long positions. (Source: Cailian Press)
- On October 13, data from the National Bureau of Statistics showed that China’s Consumer Price Index (CPI) for residents remained flat month-on-month in September, with a year-on-year increase of 0.4%, marking a slowdown in growth. The Producer Price Index (PPI) saw a narrowing month-on-month decline but a widening year-on-year decline. Both CPI and PPI year-on-year performance fell short of market expectations. (Source: Securities Times)
- On October 18, the National Bureau of Statistics released economic data for September 2024. September retail sales increased 3.2% year-on-month, cumulative fixed-asset investment rose 3.4% year-on-year, industrial value-added increased 5.4% month-on-month, and Q3 GDP grew 4.6% year-on-year. The cumulative GDP growth for the first three quarters was 4.8% year-on-year. (Source: Cailian Press)
- At the 2024 Financial Street Forum on October 18, People’s Bank of China Governor Pan Gongsheng delivered a keynote speech. Discussing the need to achieve dynamic economic balance, he emphasized that macroeconomic policy should shift from its previous focus on investment to a balanced approach prioritizing both consumption and investment, with greater emphasis on consumption. (Source: Cailian Press)
Numpy Quantitative Application Case [4]
Breaking Out of Flag Patterns
Recently, I chatted with a prominent quantitative hedge fund manager about market trends. He sent me this image:
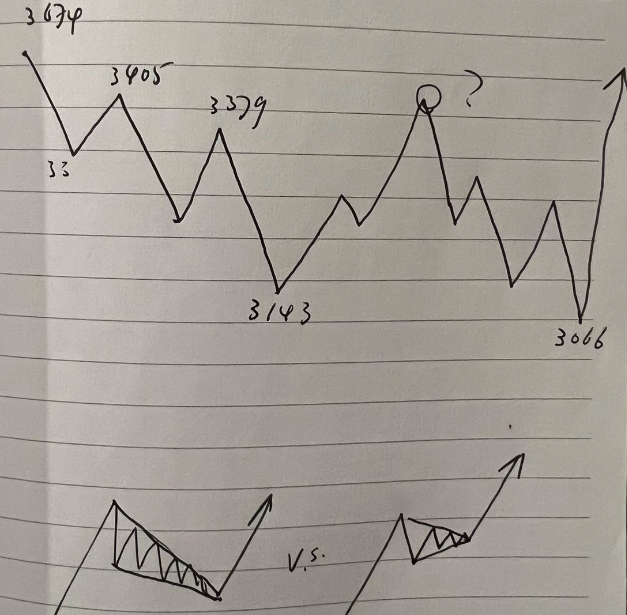
He once again accurately pinpointed the bottom level (3143, not 3066; the Shanghai Composite actually dipped to 3152 on Friday). However, I was more curious about his research methodology, specifically the lower half of the image. Knowing the approximate bottom, and combining it with information such as gaps and previous lows, it is indeed possible to predict bottom levels with reasonable precision.
I replied at the time that I was busy teaching classes, but I would write out the triangle detection algorithm when I had time.
This detection is not difficult. Writing a teaching example takes about an hour.
Before sharing my algorithm, I recommend an external solution. While it is also teaching code, it is clearly less elegant than my quick draft, so I’ll allow myself a small moment of pride. However, the benefit is that his code may be easier to read.
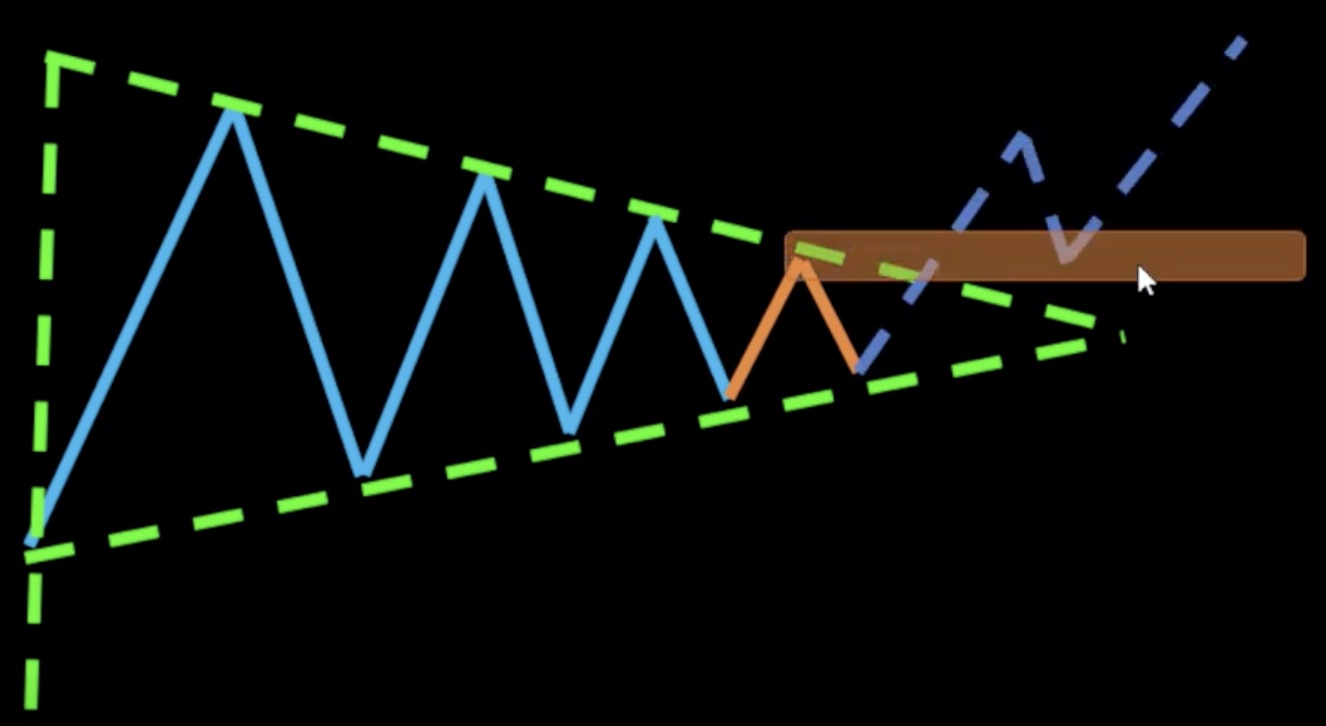
The so-called "flag pattern" (or triangle detection) is illustrated below:
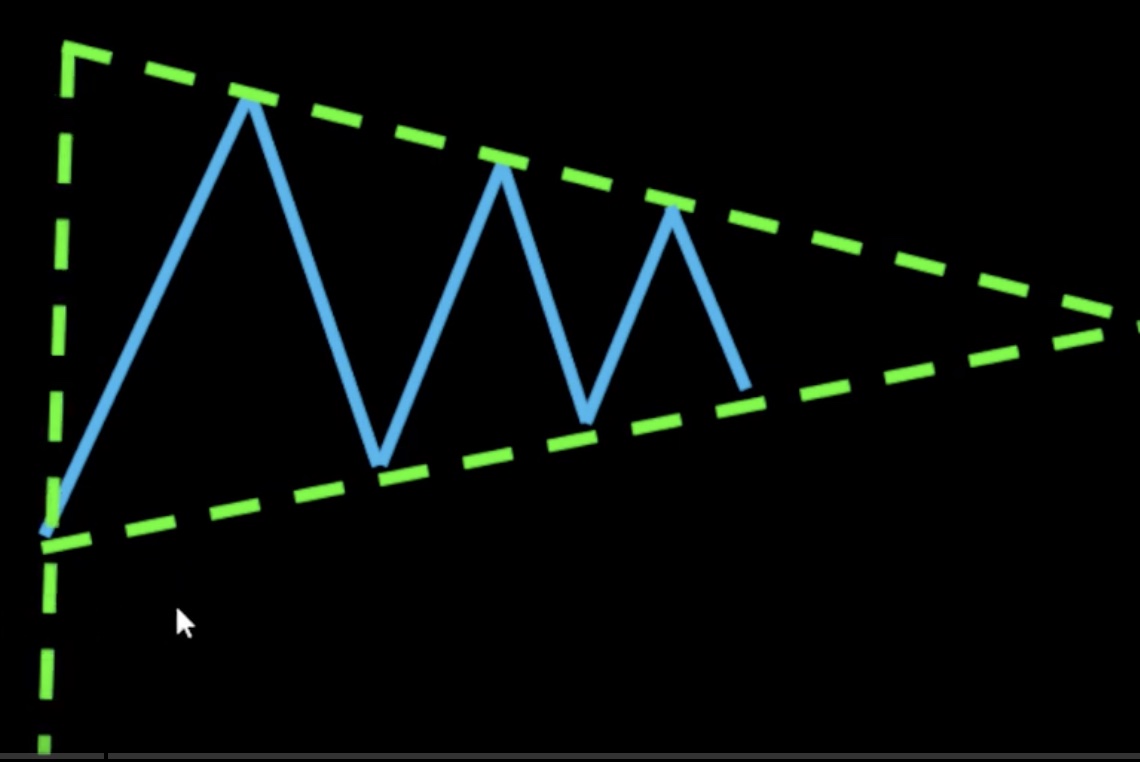
In this chart, connecting the local highs of each upward move forms a resistance line, while connecting the local lows of downward moves forms a support line.
If we draw a vertical line at the starting point, we form a small flag, which gives the pattern its name.
The special feature of flag patterns is that the end of the consolidation period seems predictable because the trading space between the two lines narrows over time.
When the width becomes less than one ATR, it indicates that the consolidation must end and a direction is about to be chosen.
The following chart shows the narrowing oscillation amplitude over time:
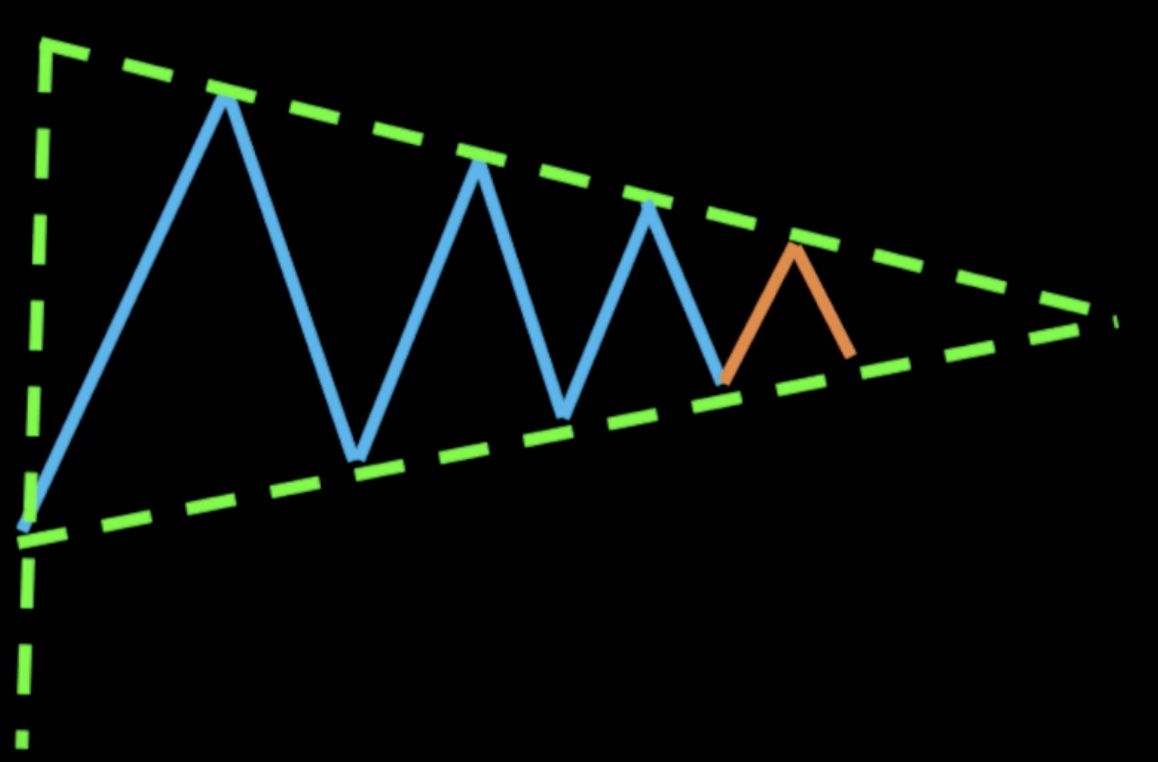
Eventually, the stock price will choose a direction. Once a direction is chosen, it is often followed by a significant market move (up or down):
Therefore, automating the detection of flag patterns serves several purposes:
- If currently in a flag pattern, set reasonable swing expectations.
- Detect when consolidation is nearing its end and reduce positions to wait for direction.
- Immediately increase positions once the direction is confirmed.
Now, let’s look at how to implement this. First, consider this asset:
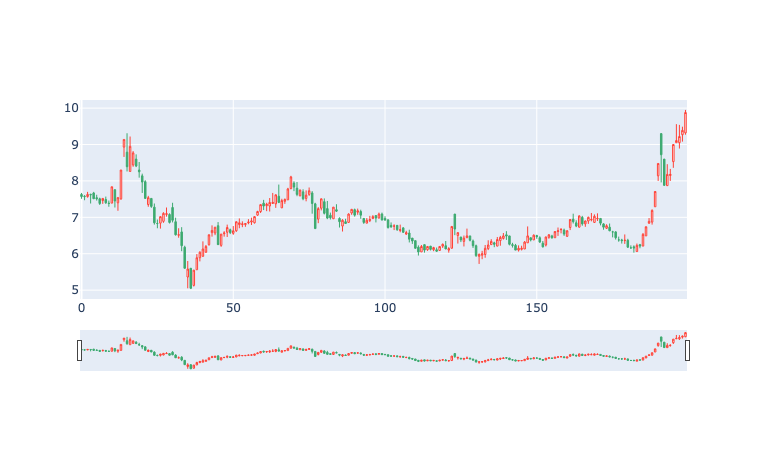
This is after the price has risen. Now, look at its state before the rise:
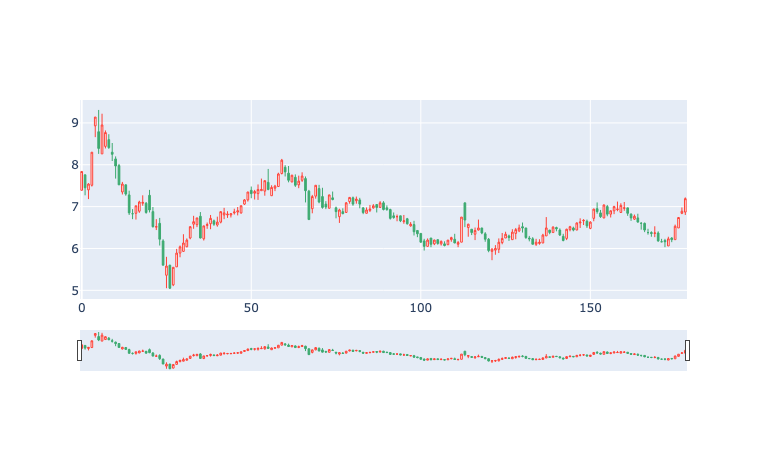
Visually, the flag pattern is faint.
Our algorithm proceeds in these steps:
- Find the coordinates of peaks and valleys for each phase.
- Fit trendlines using these coordinates and their closing prices.
- Generate trendlines using
np.poly1d. - Plot the trendlines and candlestick chart on the same graph.
def find_peak_pivots(df, win):
local_high = (df.close.rolling(win)
.apply(lambda x: x.argmax()== win-1))
local_high[:win] = 0
# find_runs function is covered in Quant 24 Lessons
v,s,l = find_runs(local_high)
peaks = []
i = 0
while i < len(v):
if l[i] >= win // 2:
if s[i] > 0:
peaks.append(s[i] - 1)
for j in range(i+1, len(v)):
if l[j] >= win // 2:
peaks.append(s[j] - 1)
i = j
if j == len(v)-1:
break
return peaksdef find_valley_pivots(df, win):
local_min = (df.close.rolling(win)
.apply(lambda x: x.argmin()== win-1))
local_min[:win] = 0
v,s,l = find_runs(local_min)
valleys = []
i = 0
while i < len(v):
if l[i] >= win // 2:
if s[i] > 0:
valleys.append(s[i] - 1)
for j in range(i+1, len(v)):
if l[j] >= win // 2:
valleys.append(s[j] - 1)
i = j
if j == len(v)-1:
break
return valleys
def trendline(df):
peaks = find_peak_pivots(df, 20)
valleys = find_valley_pivots(df, 20)
y = df.close[peaks].values
p = np.polyfit(x=peaks, y = y, deg=1)
upper_trendline = np.poly1d(p)(np.arange(0, len(df)))
y = df.close[valleys].values
v = np.polyfit(x=valleys, y = y, deg=1)
lower_trendline = np.poly1d(v)(np.arange(0, len(df))) candle = go.Candlestick(x=df.index,
open=df['open'],
high=df['high'],
low=df['low'],
close=df['close'],
line=dict({"width": 1}),
name="K-Line",
increasing = {
"fillcolor":"rgba(255,255,255,0.9)",
"line": dict({"color": RED})
},
decreasing = {
"fillcolor": GREEN,
"line": dict(color = GREEN)
})
upper_trace = go.Scatter(x=df.index,
y=upper_trendline,
mode='lines',
name='Resistance Line')
lower_trace = go.Scatter(x=df.index,
y=lower_trendline,
mode='lines',
name='Support Line')
fig = go.Figure(data=[candle,lower_trace, upper_trace])
fig.show()Finally, we detect the pattern of this asset before its rise, yielding the following result:
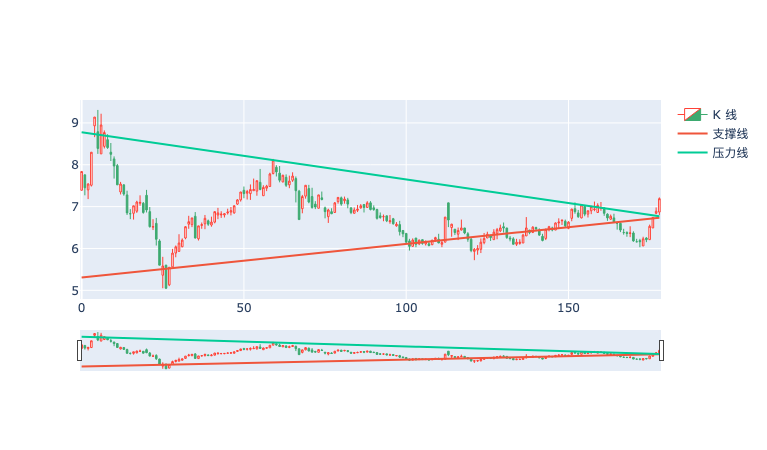
This result indicates that when the flag pattern ends, the direction of the breakout is influenced by the broader market, retaining some uncertainty. However, since it did not break below the previous low, this was key to consolidating consensus and reversing upward.
Let’s look at another asset that multiplied by 7x in the last month:
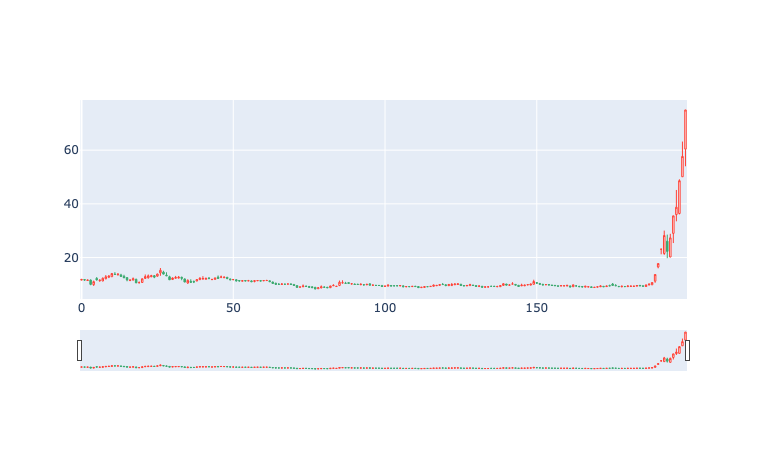
This is the pattern before the rise:
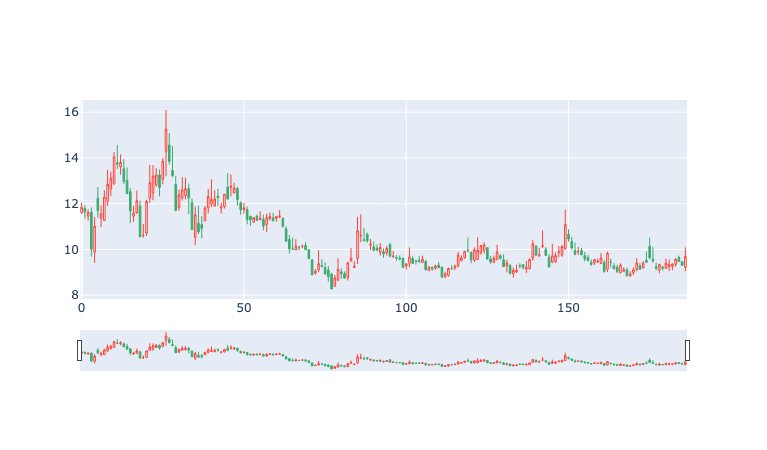
This is the detected flag pattern:
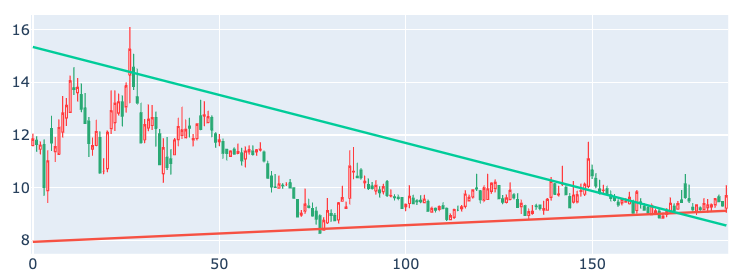
Perfect capture!
Of course, this is just example code. In practical application, due to the use of small-sample linear regression, the results can be unstable. To use this as production code, additional methods are needed to stabilize predictions. Regardless, we have taken a critical step.
The runnable code (.ipynb file) is available in the Knowledge Planet. As it is under construction, it is currently offered at the lowest price.

If you find some code or terminology confusing (such as why ATR is used to determine the end of consolidation), these are covered in our Quant 24 Lessons. Welcome to enroll!
Great Courses Are Starting!

Clear Goals, Strong Sense of Achievement
Why Choose QuanTide Courses?